
Marketplace / / Session Colors Indicator

Session Colors Indicator

$0.00

This product is built exclusively for the Tickblaze platform and requires Tickblaze to be installed. Don’t have access to Tickblaze? Download it here.

Category: Free Indicators

Session Colors Indicator

Color Every Session. Map Every Range. Trade with Time-Based Context.

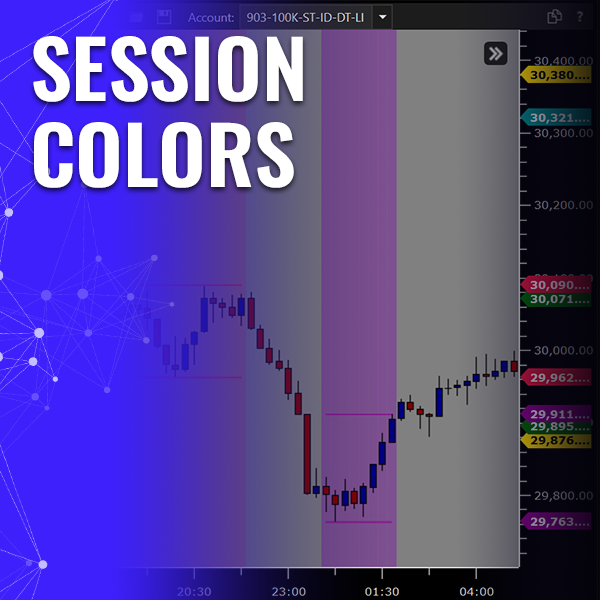
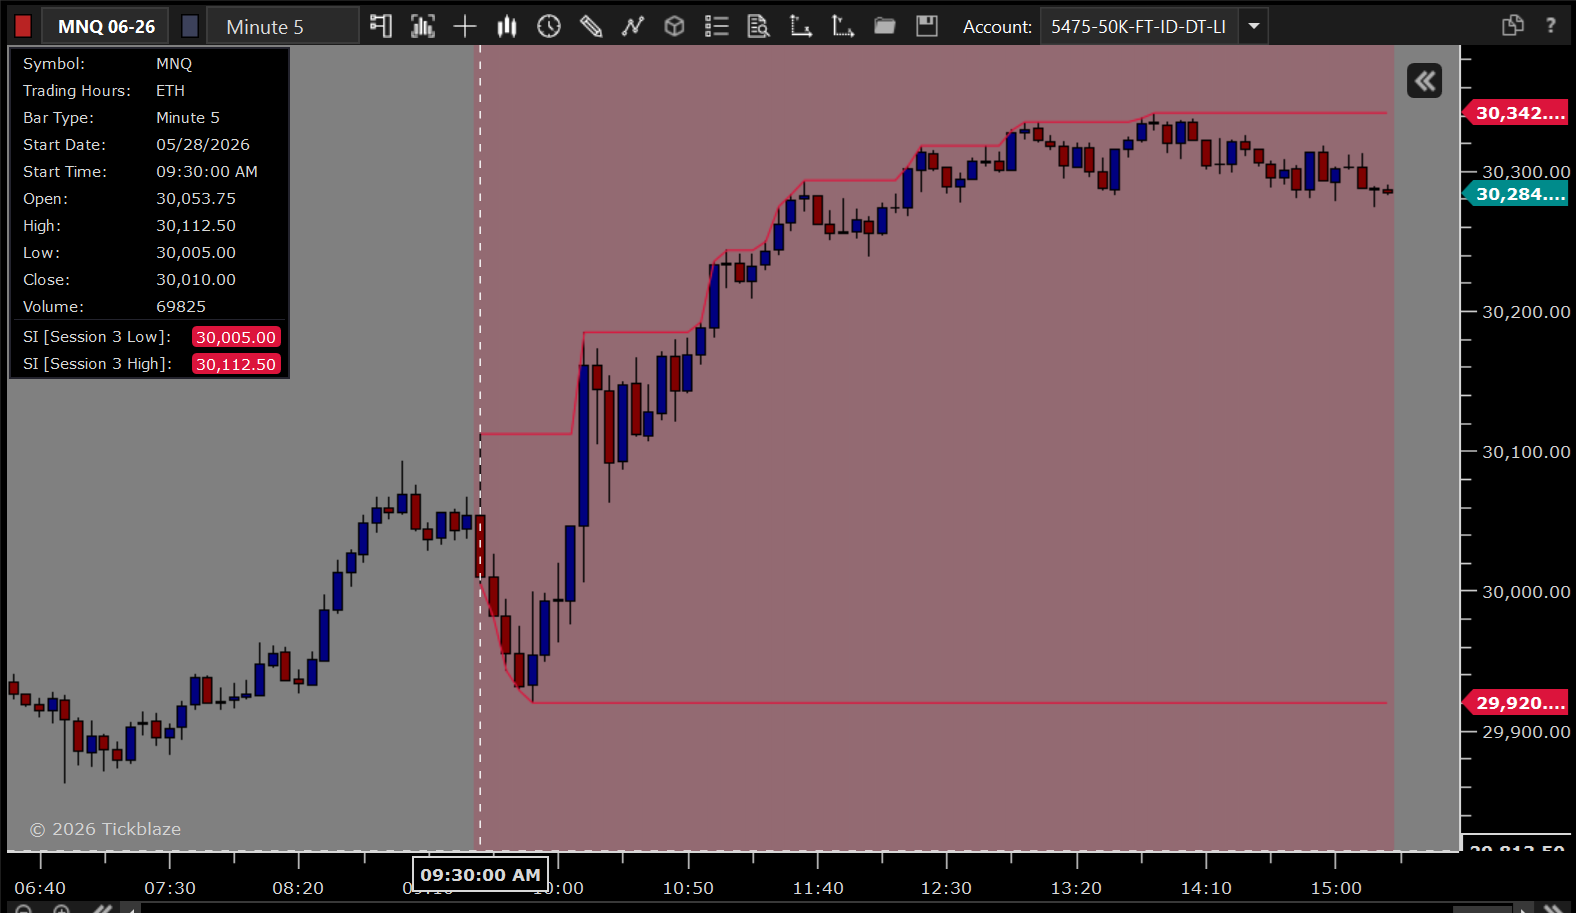
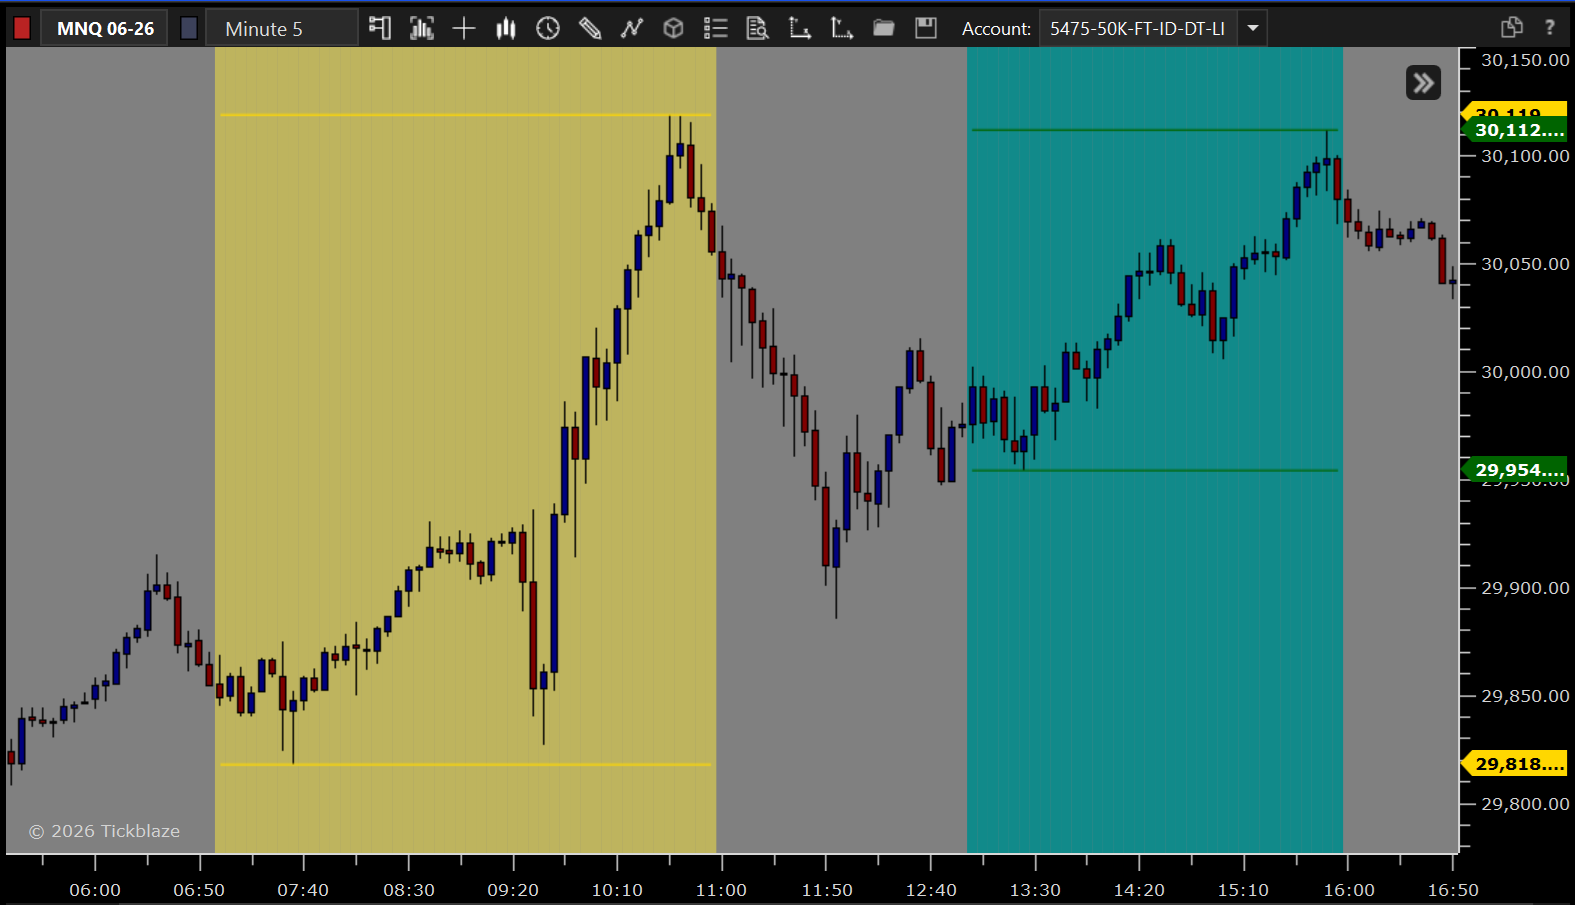
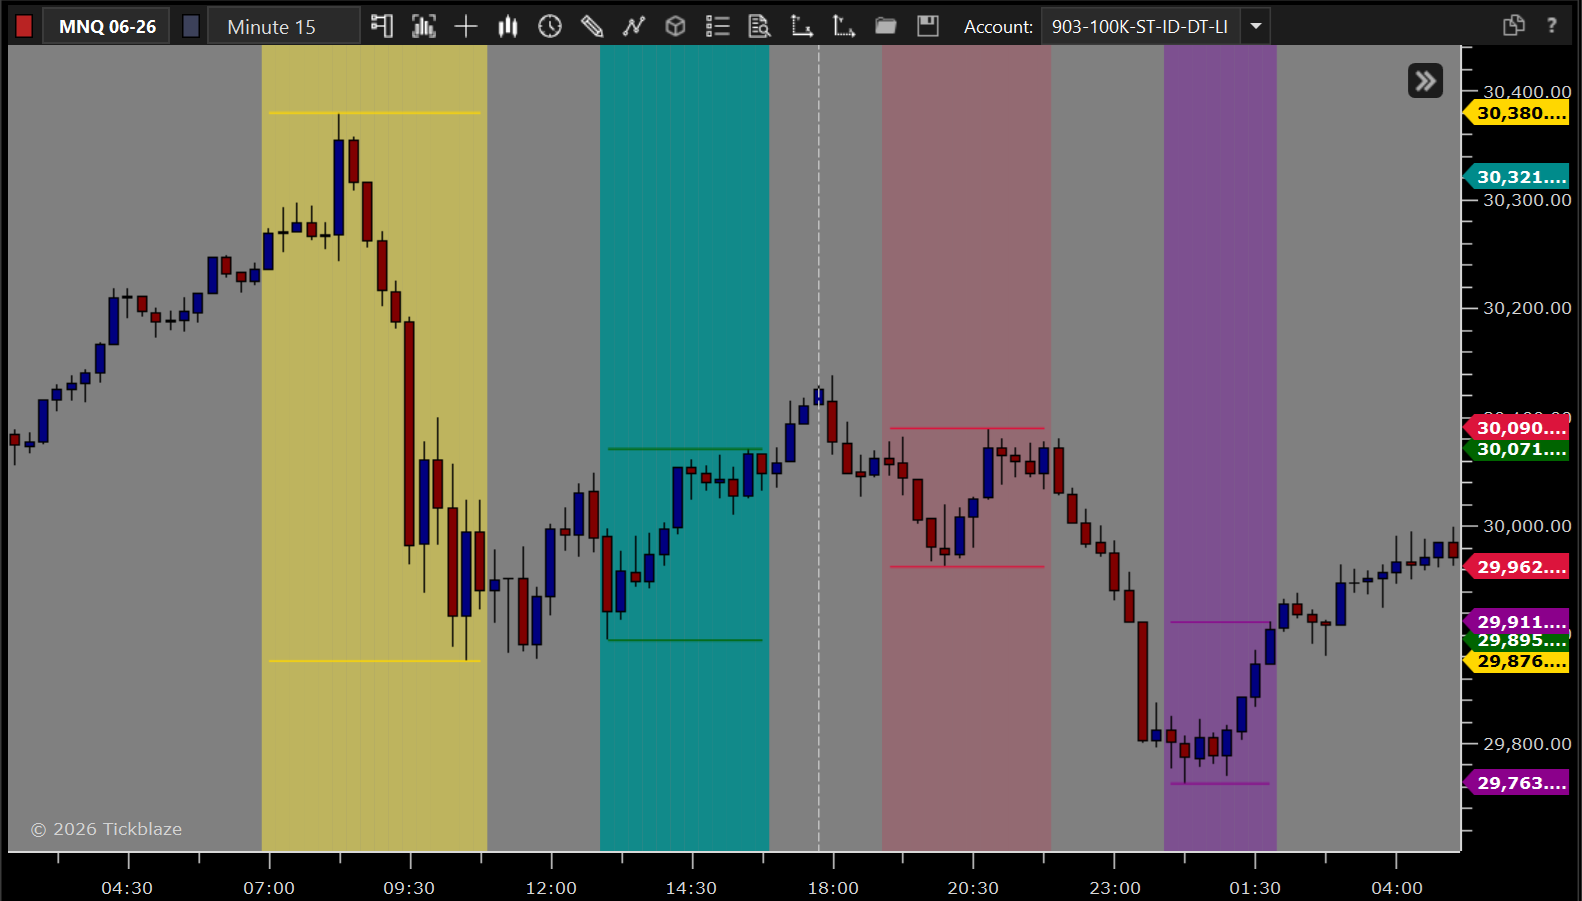
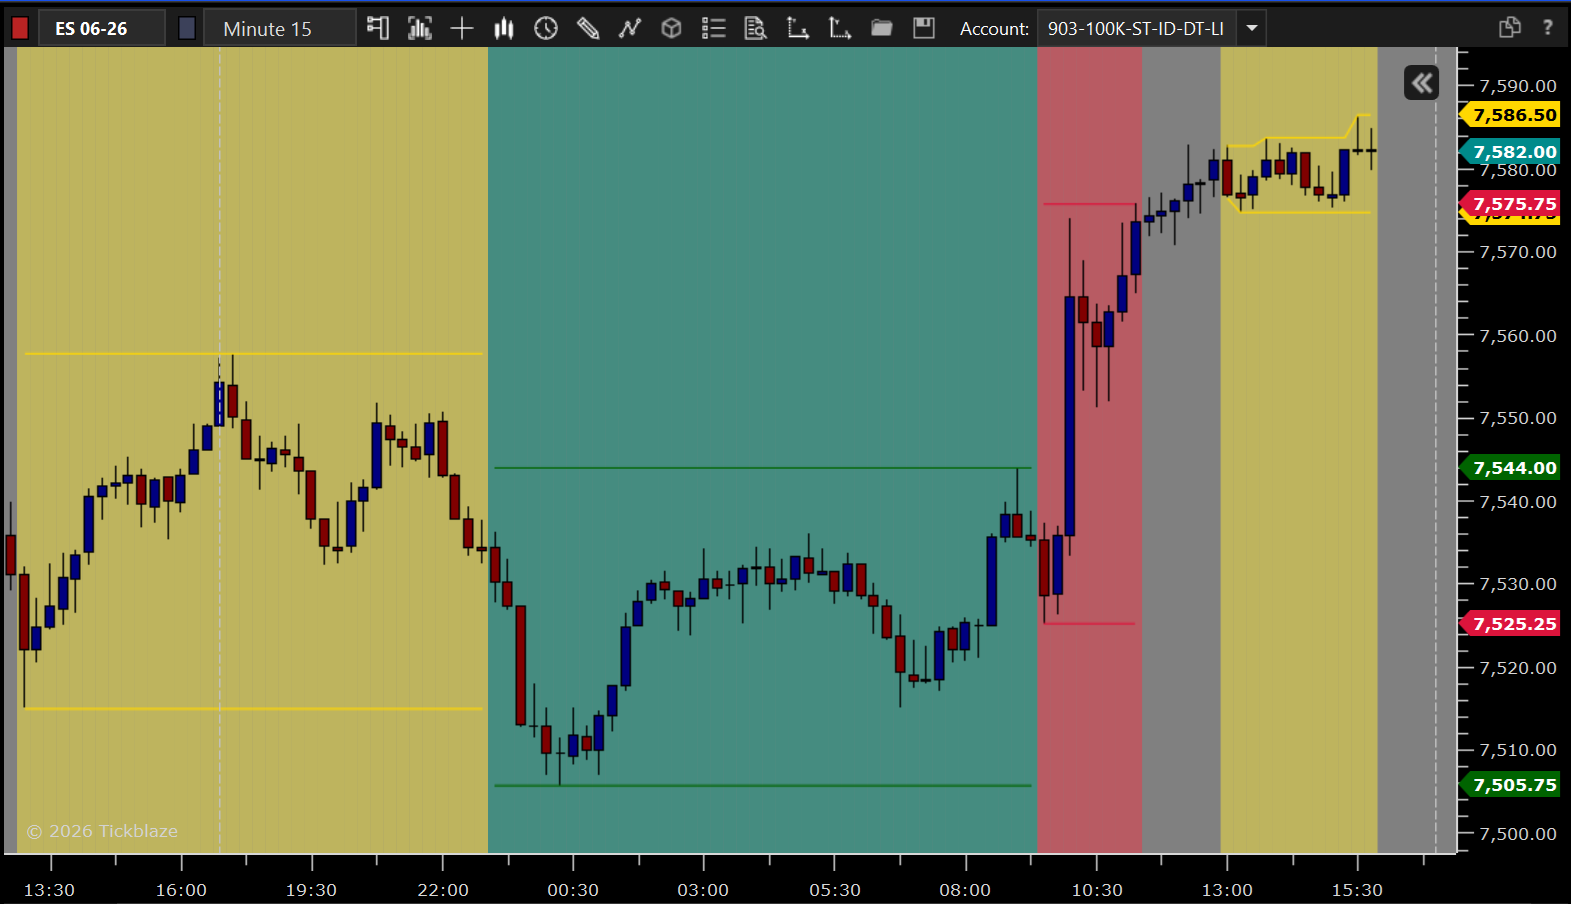
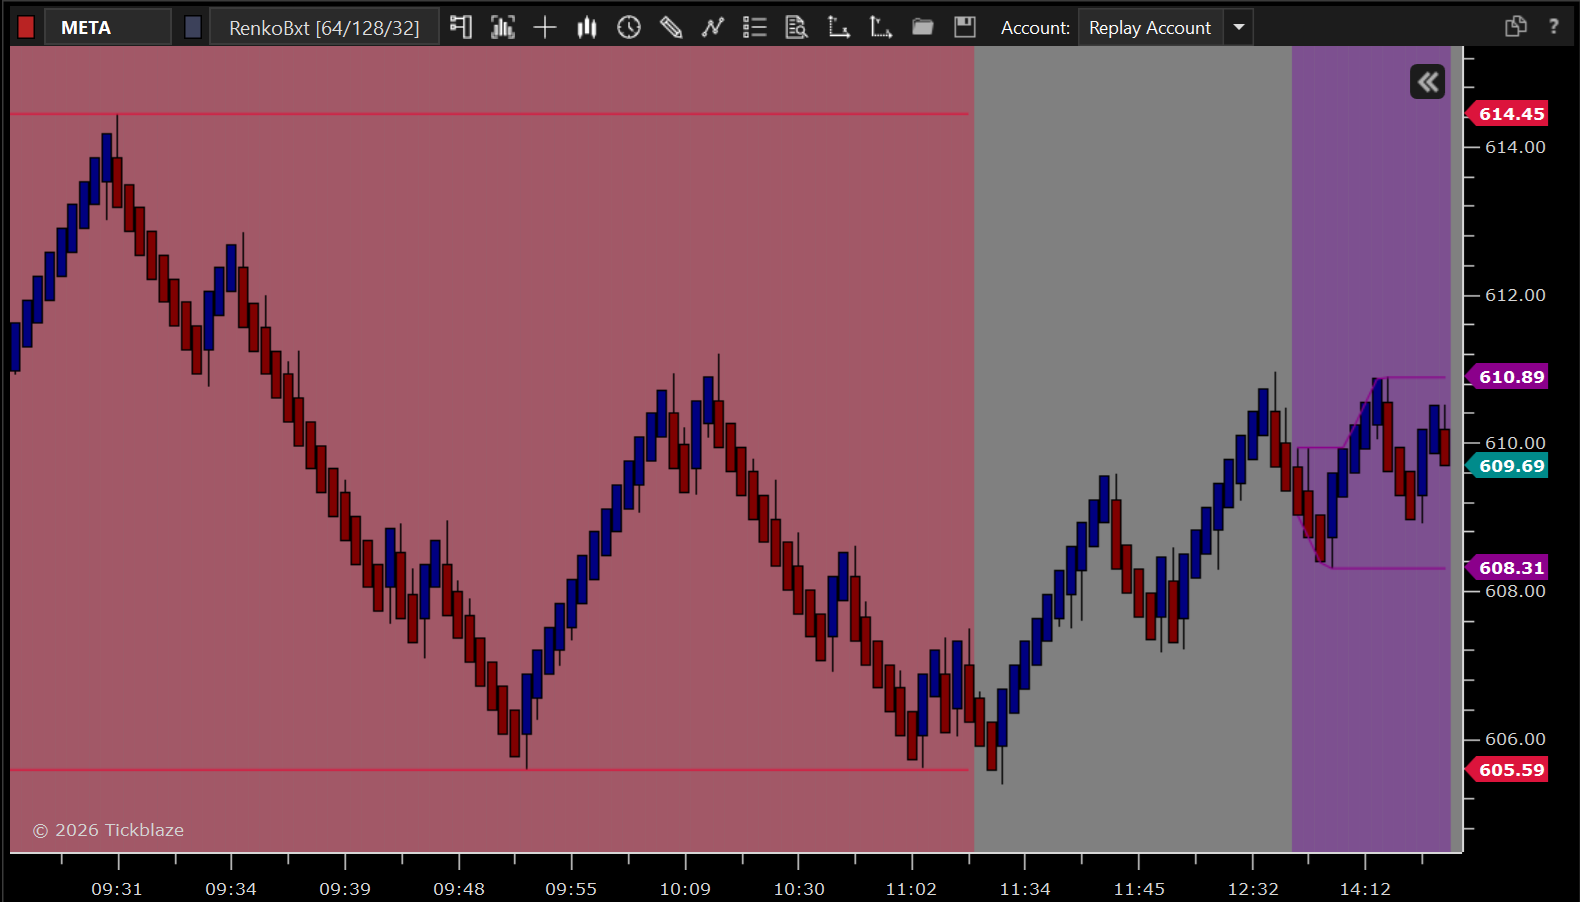
The Session Colors Indicator brings instant time-based context to your chart by visually marking up to four fully customizable trading sessions and plotting the live High and Low of each one as horizontal reference levels. Whether you’re tracking the Asian, London, and New York sessions or building any custom time-window strategy, Session Colors removes the guesswork. The result is a clean, customizable framework that turns your chart from a featureless candle stream into a time-aware liquidity map.

Why Traders Love It

  • Instant Session Context: One look tells you which session is active, no mental math on time zones or session times
  • Built-In Liquidity Mapping: Session Highs and Lows plot automatically, the levels where institutional stops actually cluster
  • Four Fully Customizable Sessions: Define any time window — Asian, London, NY, pre-market, kill zones, lunch, with independent control per session
  • Per-Session Color Control: Every session has its own color and on/off toggle for clean, focused setups
  • Optional Background Fill: Toggle session shading on or off depending on how busy you want your chart
  • Works on Any Market and Timeframe: Futures, stocks, forex, crypto — any chart, any bar type
  •  

Core Features

  • Up to 4 independently configurable trading sessions
  • Customizable Start and End times (24-hour format) per session
  • Per-session color customization for both background fill and range lines
  • Real-time Session High and Low plotting as horizontal lines
  • Per-session enable/disable toggle
  • Master Background Fill toggle for the entire indicator
  • Compatible with all bar types and timeframes
  • Solves These Common Mistakes


Solves These Common Mistakes

  • Missing the obvious liquidity pools at prior session Highs and Lows
  • Drawing session boundaries manually and getting the times wrong
  • Ignoring the time context that drives volume and volatility
  • Cluttering the chart with multiple separate session tools
  • Losing track of when the major sessions actually open and close in your local time
  • Building strategies blind to which session is currently driving price


Auto Divergence Launch | 72% Off | No Code Needed
X
0