Sale!

L2 Heatmap

Original price was: $4,475.00.Current price is: $795.00.

Included With Purchase:

  • One-Time License
    :
    $1,495
  • Lifetime Updates
    :
    $995
  • VIP Live AMA + Strategy Training
    :
    $995
  • White Glove Install/Support
    :
    $495
  • User Documentation
    :
    $495
  • Total Value
    :
    $4,475

Disclaimer

The L2 Heatmap Indicator requires access to Level 2 (L2) market data. This data is not included with the indicator and must be obtained separately. There are two supported methods for accessing L2 data:

  1. Purchase it through your prop firm (if available).
  2. Subscribe directly from dxFeed.

Please ensure you have an active L2 data feed from one of these sources before using the L2 Heatmap Indicator. Without it, the indicator will not function as intended.

This product is built exclusively for the Tickblaze platform and requires Tickblaze to be installed. Don’t have access to Tickblaze? Download it here.

*This Tickblaze Marketplace Product requires a $295 annual maintenance fee after the first year. This fee is charged per user—not per purchase. For additional information, please click here.

L2 Heatmap:

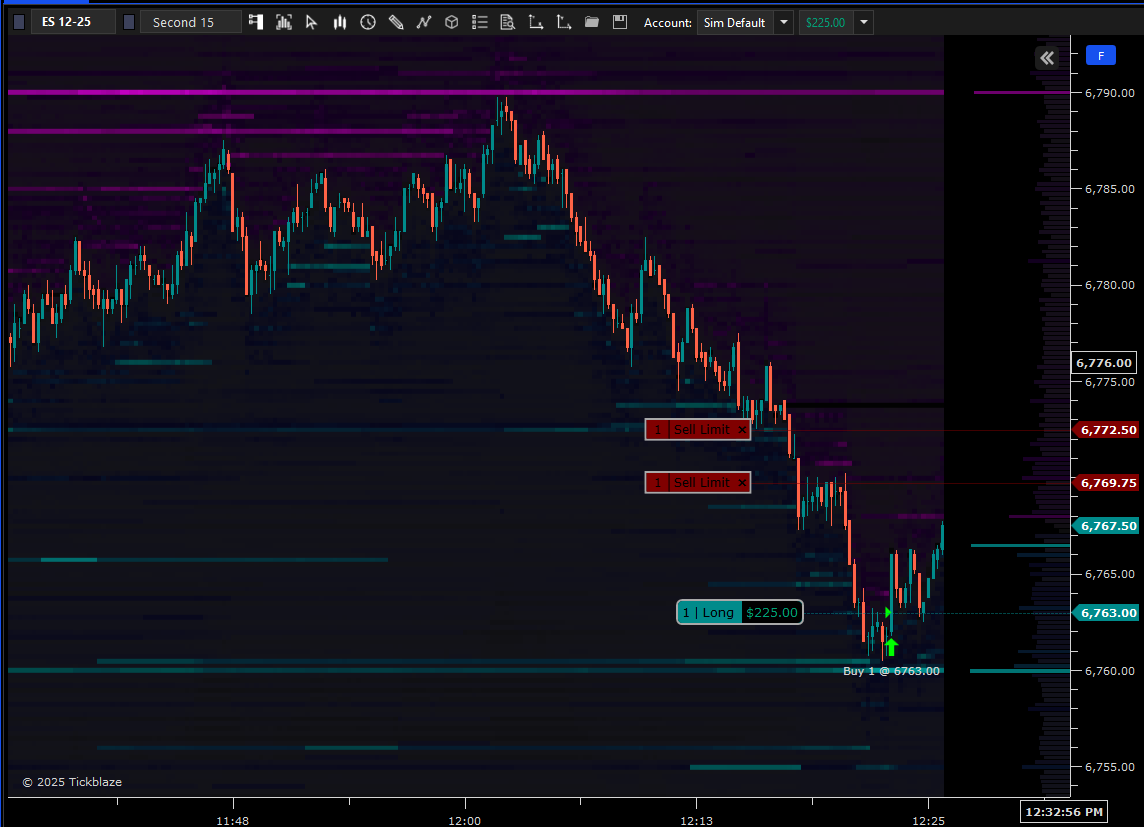
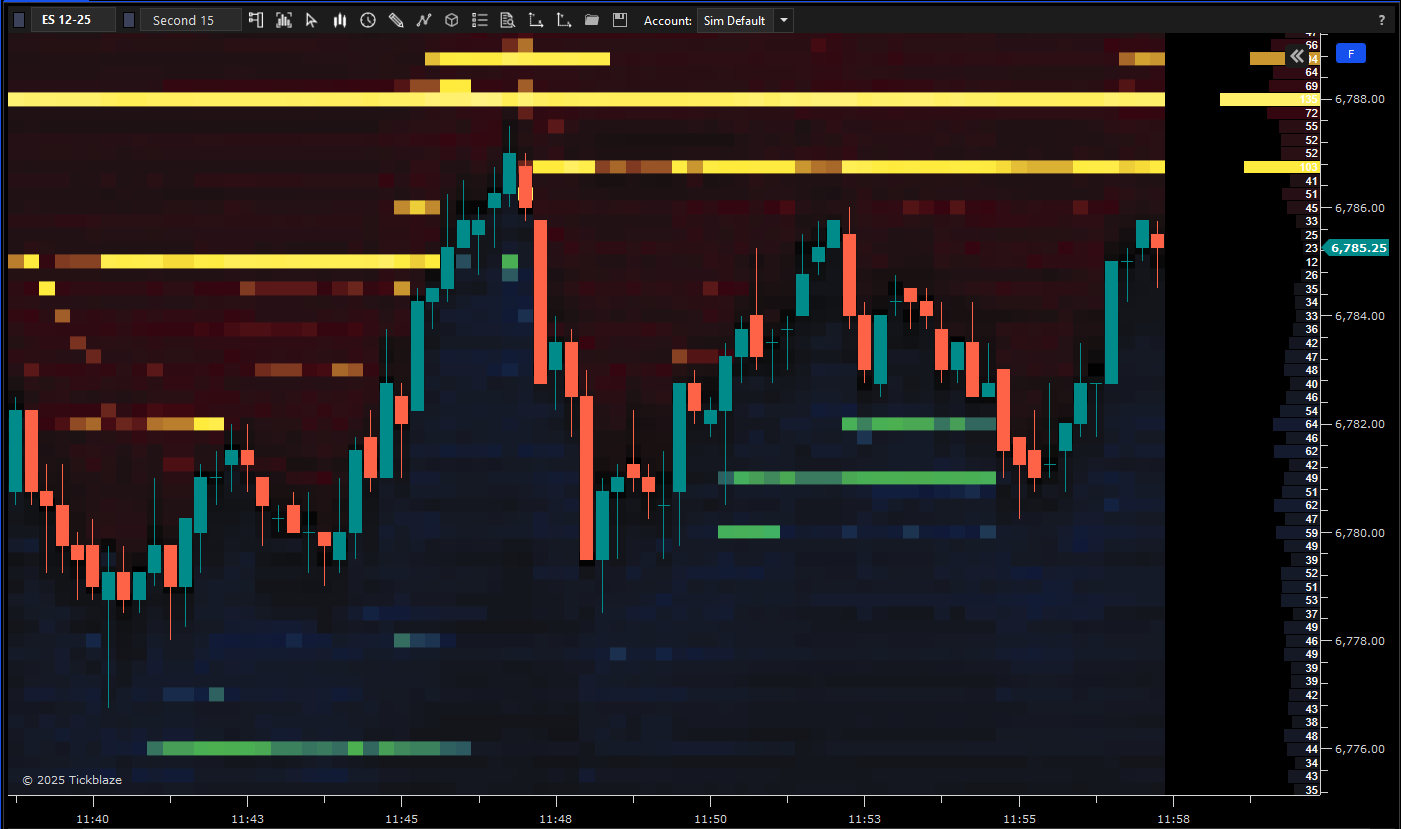
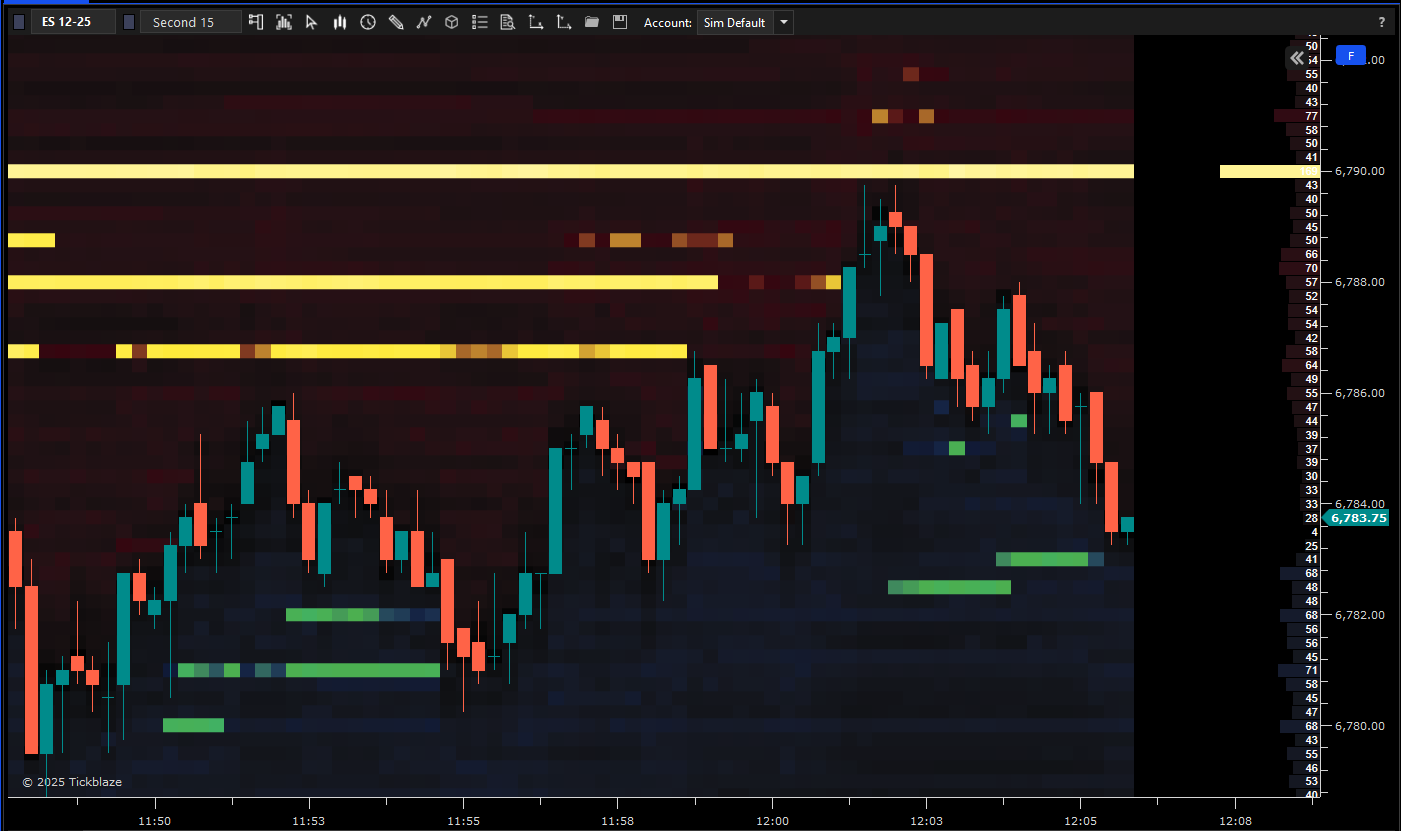
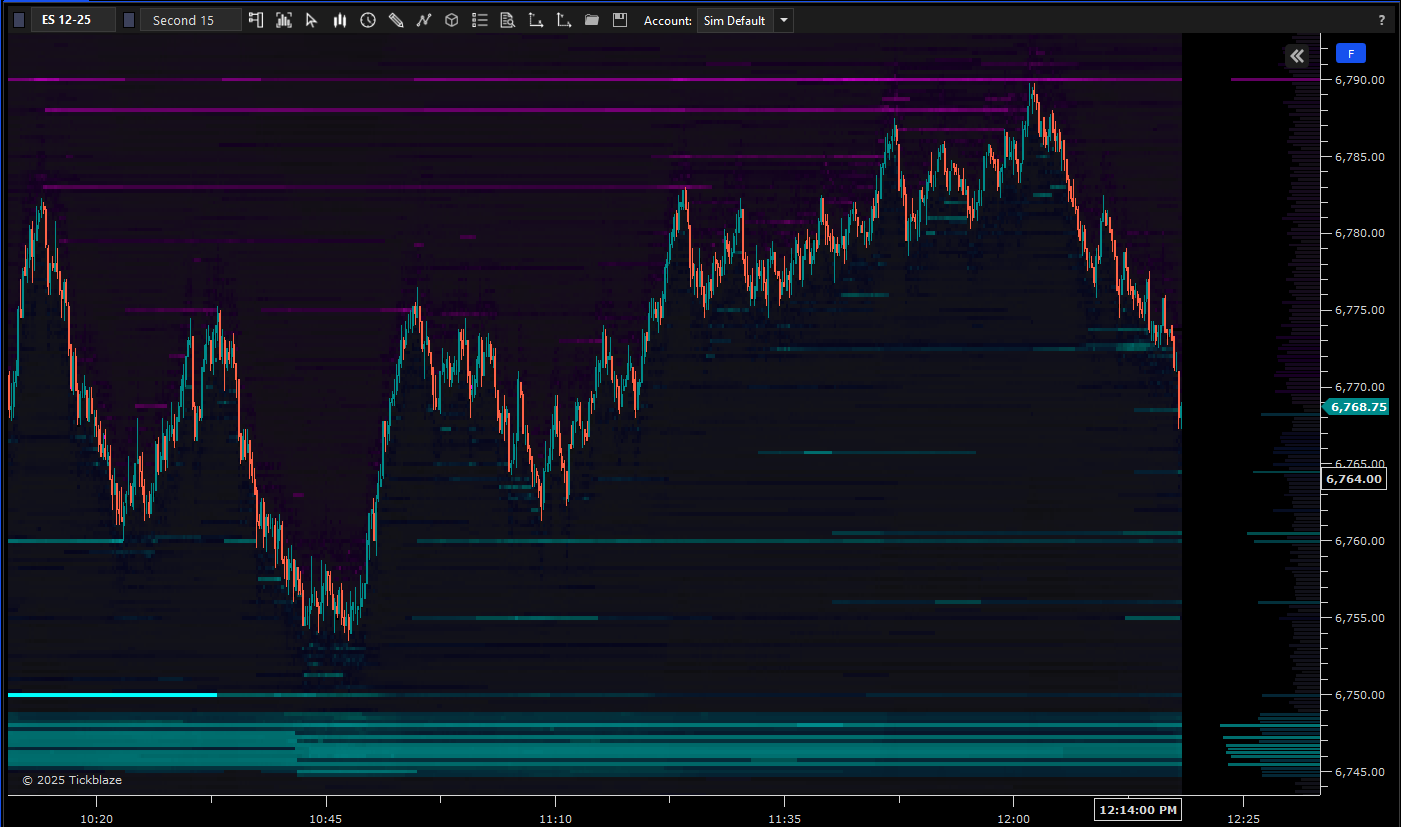
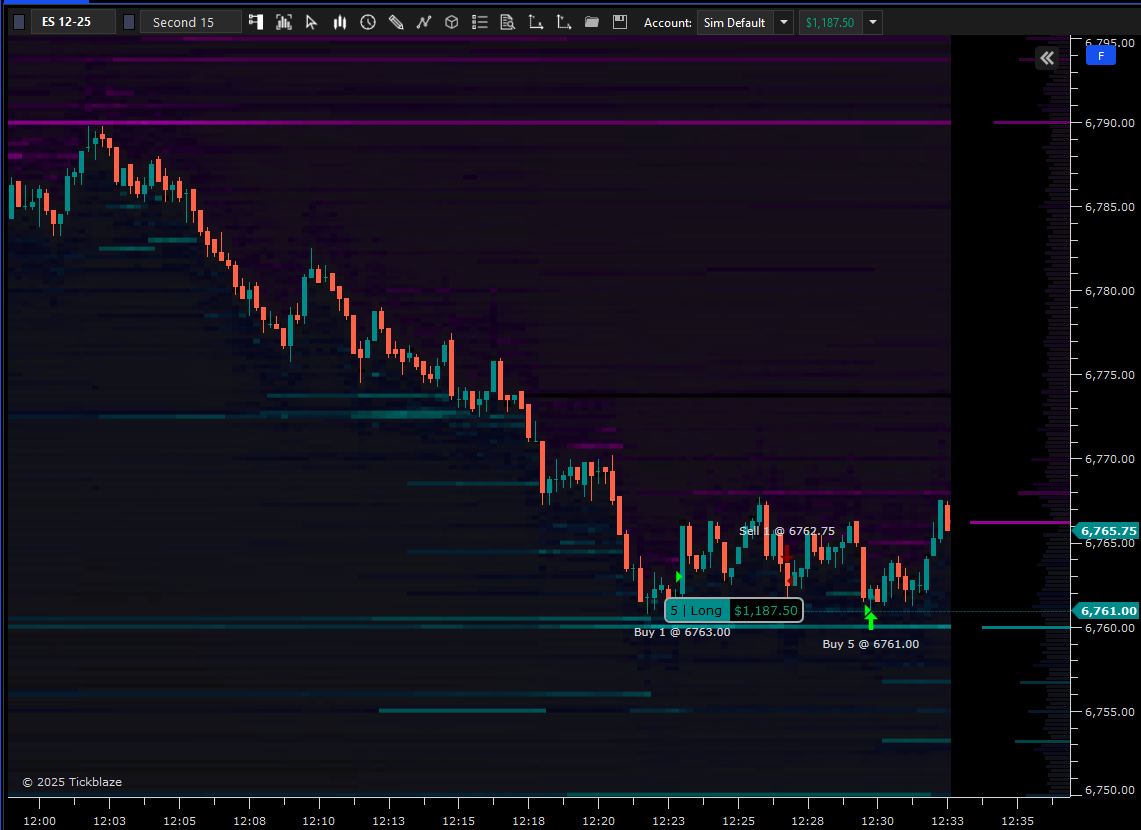
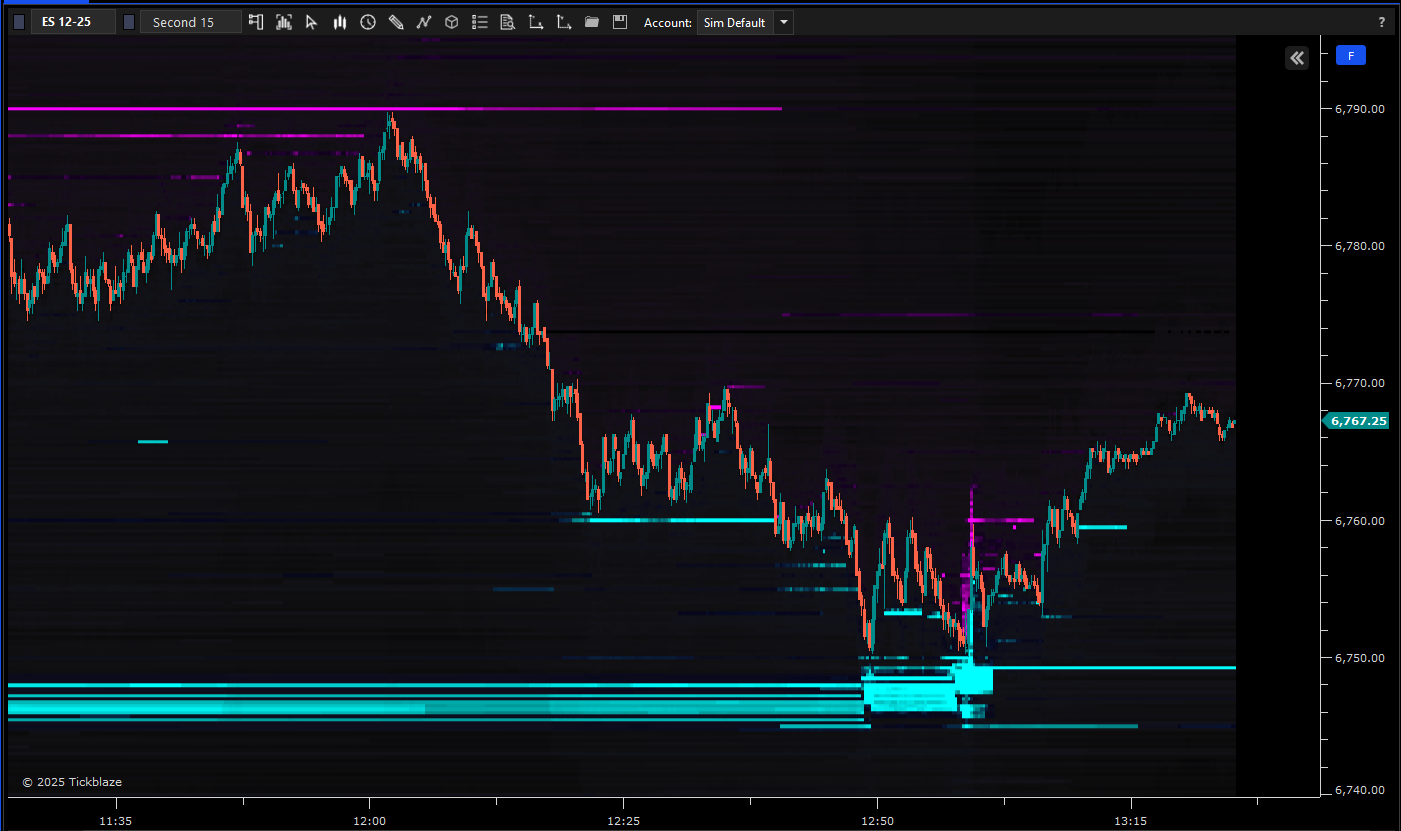
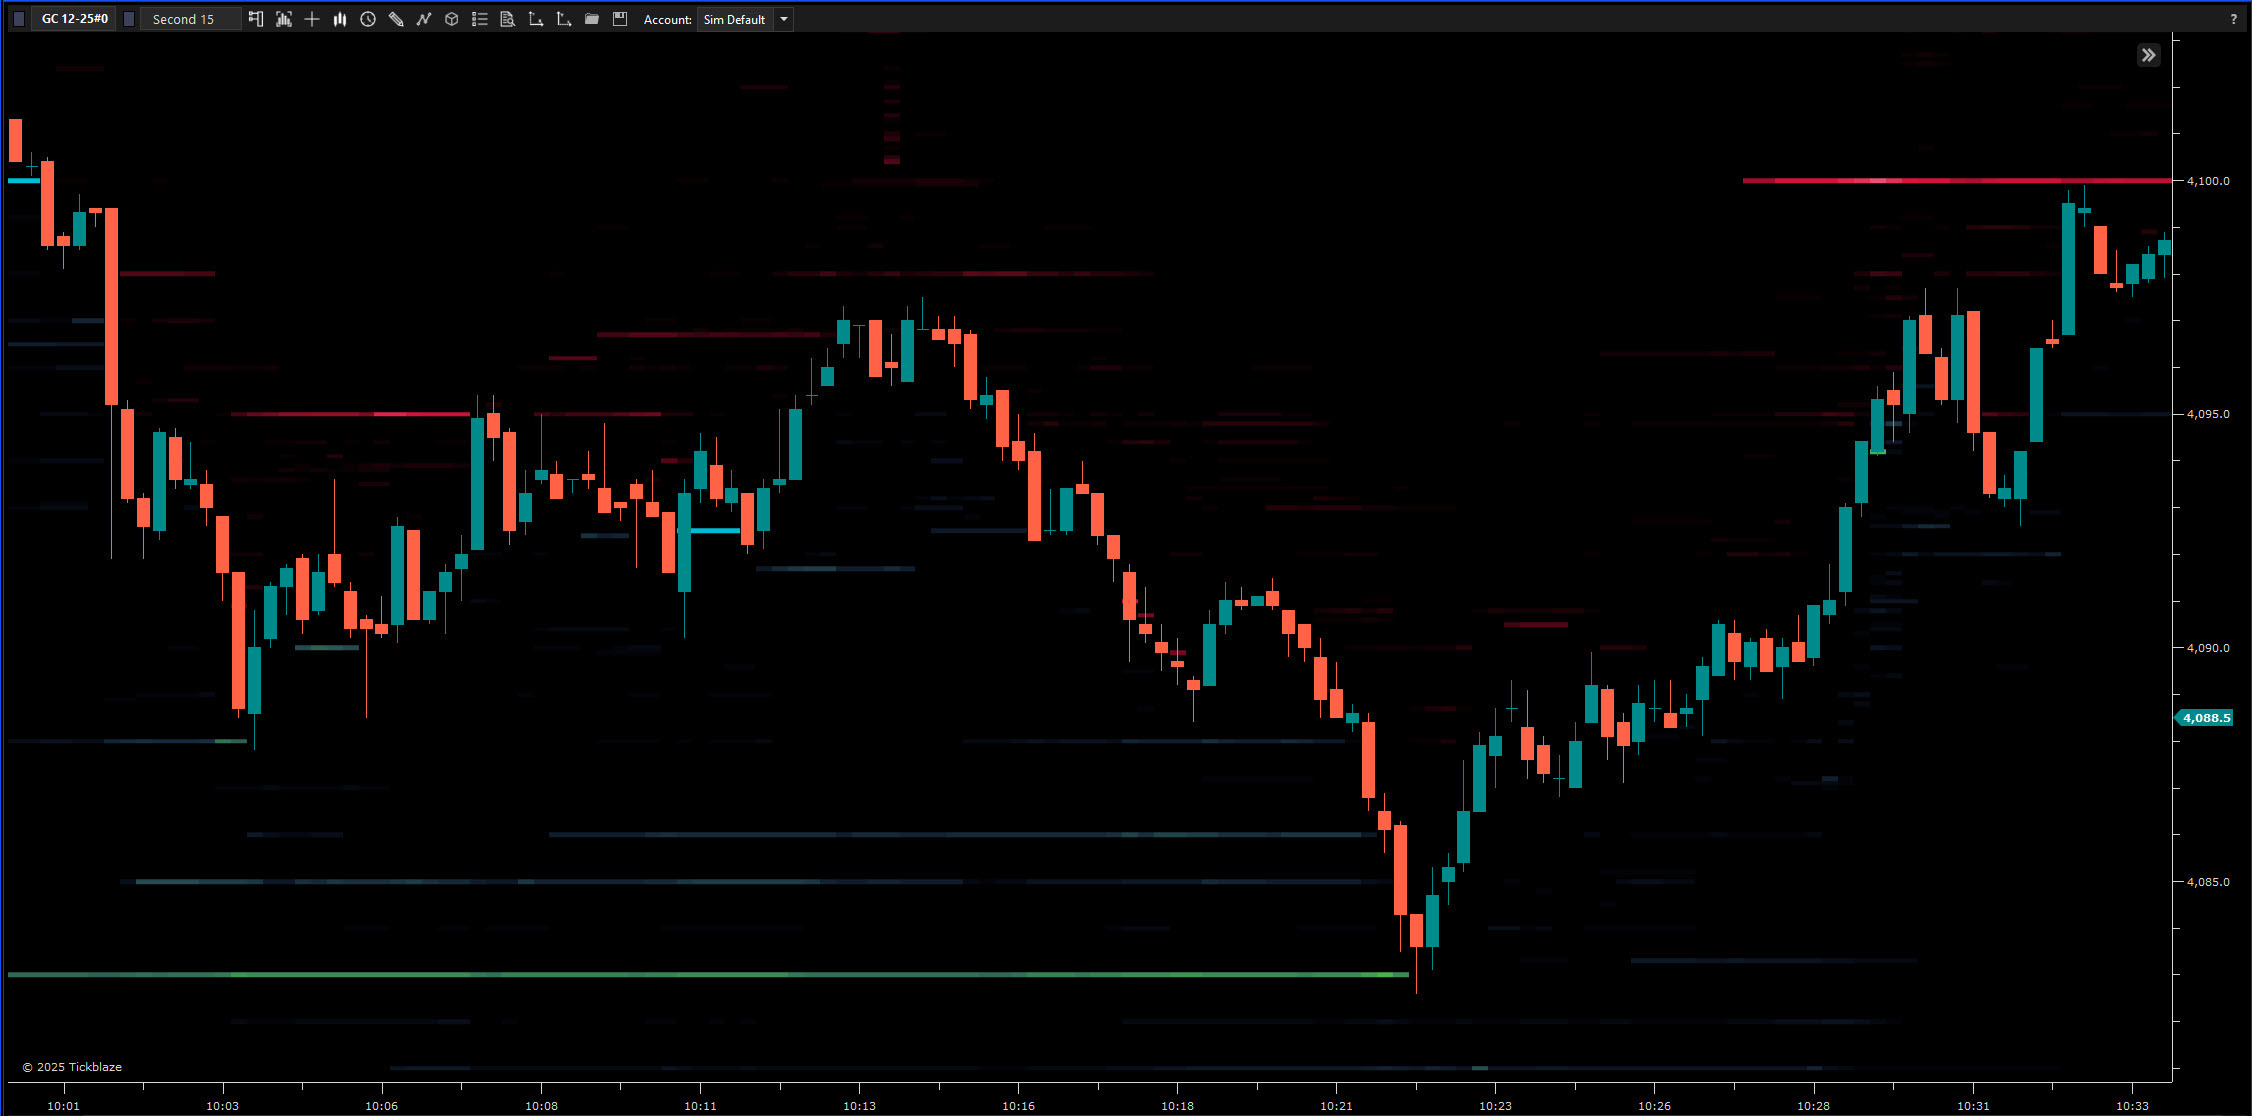
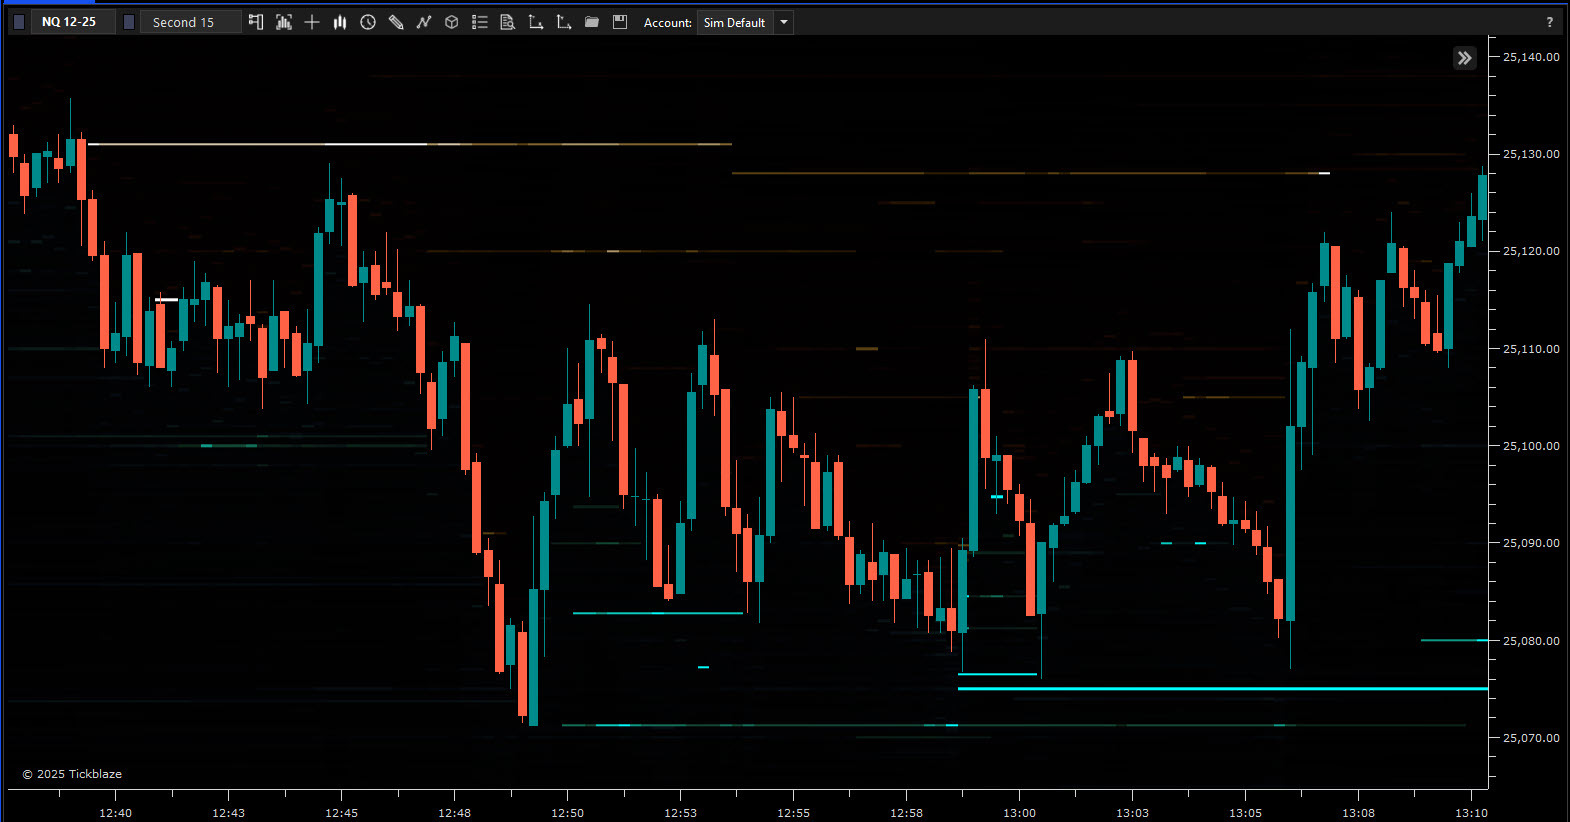
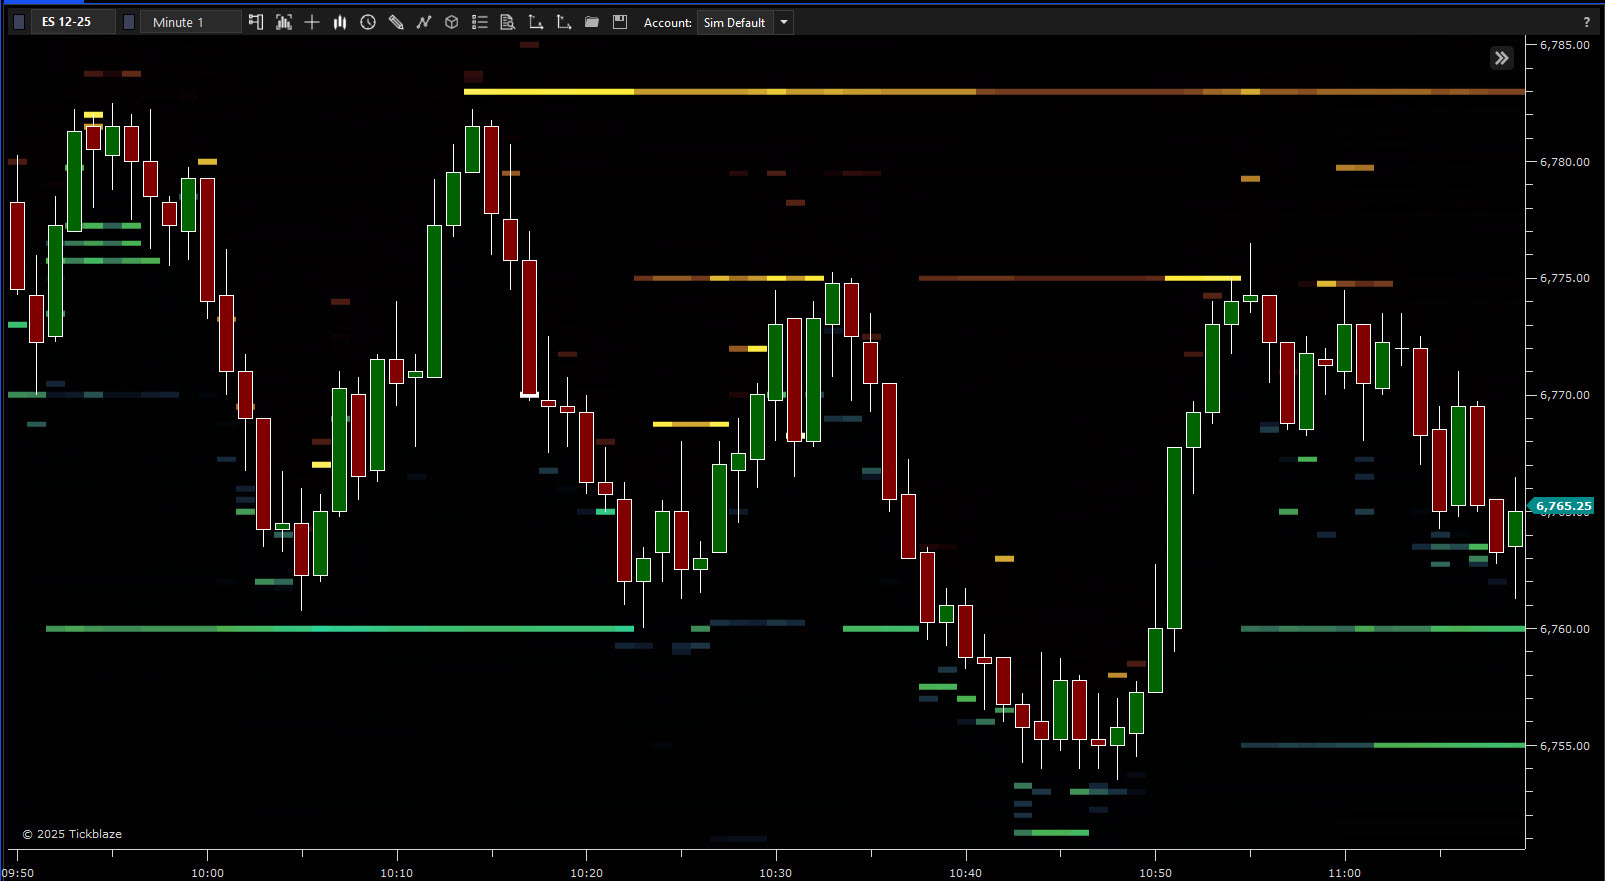
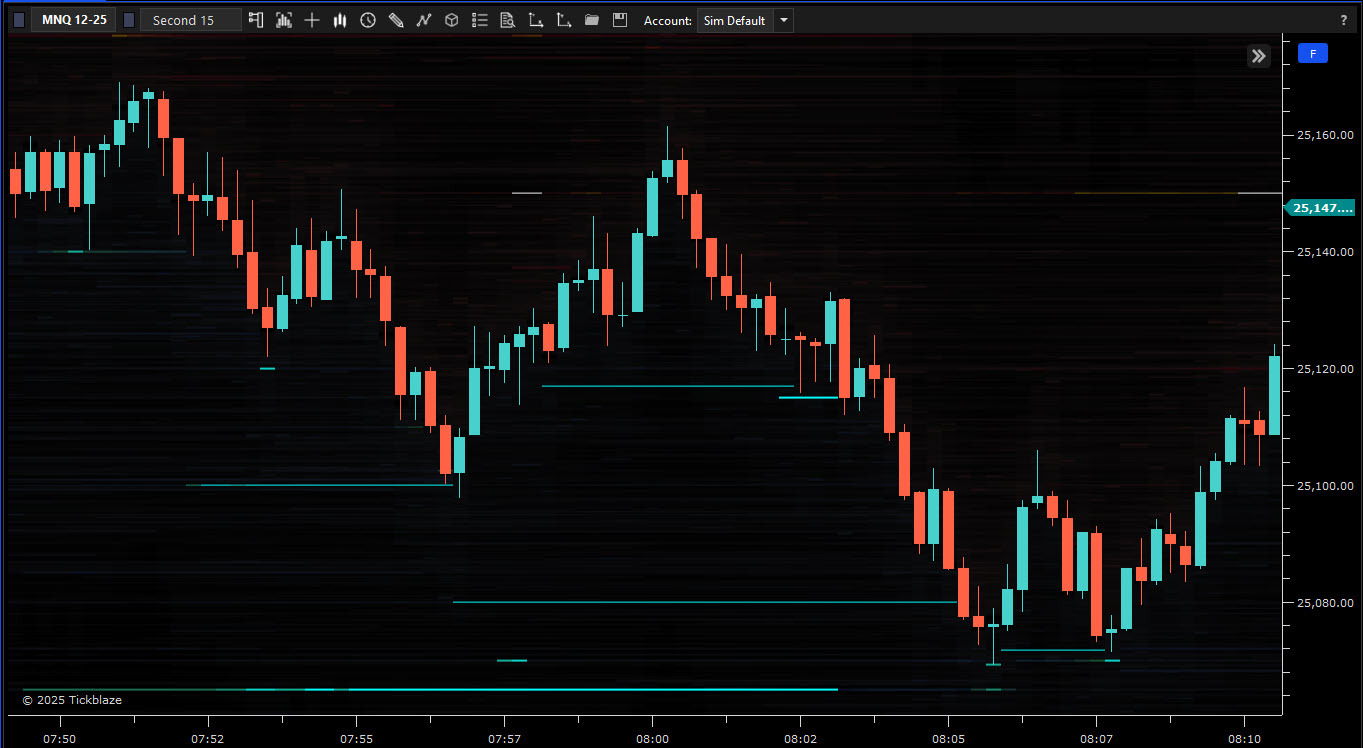
Visualizing Institutional Liquidity: Anticipate Market Reactions, Avoid Stop Hunts.

The Liquidity Heatmap Indicator is a cutting-edge institutional-grade analysis tool that provides traders with a real-time, predictive map of hidden supply and demand zones. It translates complex, multi-level Order Book data into an easy-to-read color gradient heatmap right on your price chart, showing you the price levels where major buy and sell interest (liquidity) is currently clustered. This visibility allows you to distinguish between genuine turning points and false moves, empowering you to execute trades with superior timing, set optimal targets, and understand the market’s true intentions – a fundamental edge over lagging indicators – making the Liquidity Heatmap a must have for any serious trader.

WHY TRADERS LOVE IT:

  • Institutional Visibility: See the price levels where the “smart money” is trading
  • Leading Indicator: Recognize future support and resistance levels before price reaches them
  • Superior Risk Management: Identify liquidity pools for strategic stop placement
  • Real-Time Analysis: Instantly monitor how liquidity levels shift over time
  • Superior Trade Confirmation: Validate trade setups to increase your confidence
  • Eliminate Market Noise: Visual heatmap focusing on only the most important key areas

CORE FEATURES:

  • Real-Time Limit Order Aggregation translated into dynamic easy to read heatmap
  • Dynamic DOM Order Inventory Histogram updating in realtime for up-to-date price ladder volumes
  • Customizable 3-Stage Heat Thresholds for multi-color gradient intensity
  • Separate Support and Resistance Color Schemes enhancing visual interpretation
  • Realtime DOM Volumes Retained for historical analysis of absorption/rotation
  • Multi-Asset Class Compatibility for widespread trading application

SOLVES THESE COSTLY MISTAKES:

  • Trading Into Stop Hunts caused by ignoring high-liquidity levels
  • Relying on Subjective Support and Resistance Zones instead of objective quantifiable institutional price points
  • Chasing Price rather than waiting for optimal entry levels
  • Setting Arbitrary Targets that ignore high liquidity exit points
  • Succumbing to Fake Out Moves that are not supported by institutional participation
  • Relying on Lagging Indicators rather than predictive visualization of current, unexecuted order flow.
0