
$0.00
This product is built exclusively for the Tickblaze platform and requires Tickblaze to be installed. Don’t have access to Tickblaze? Download it here.
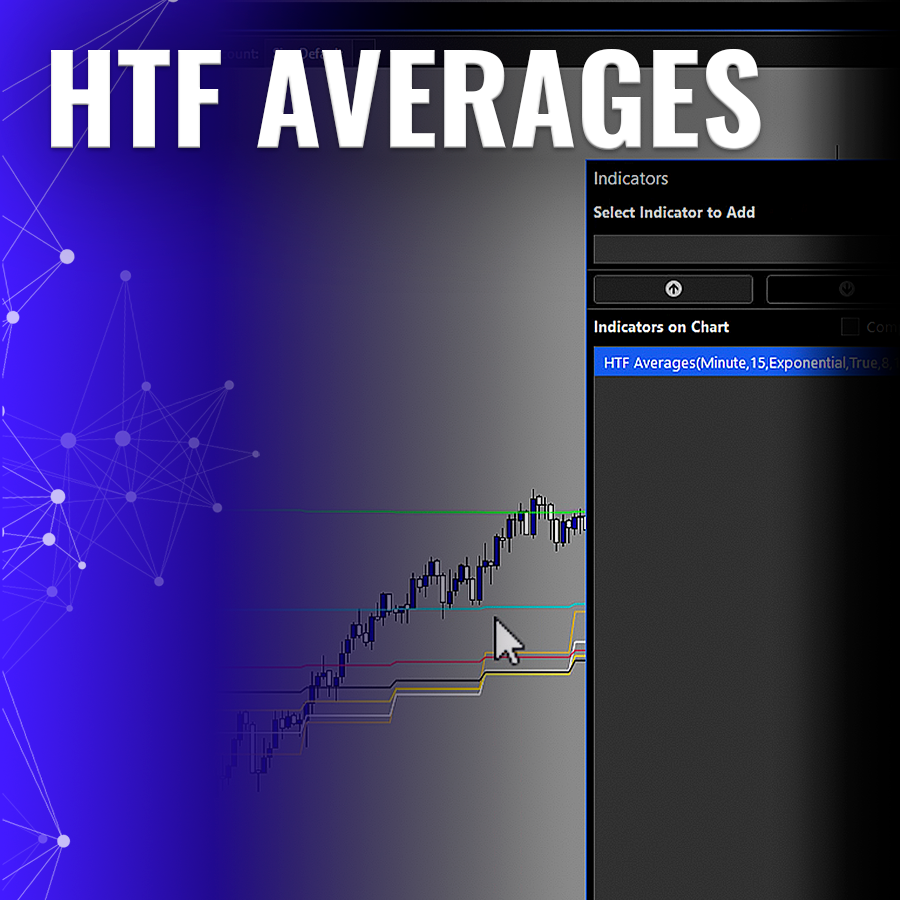
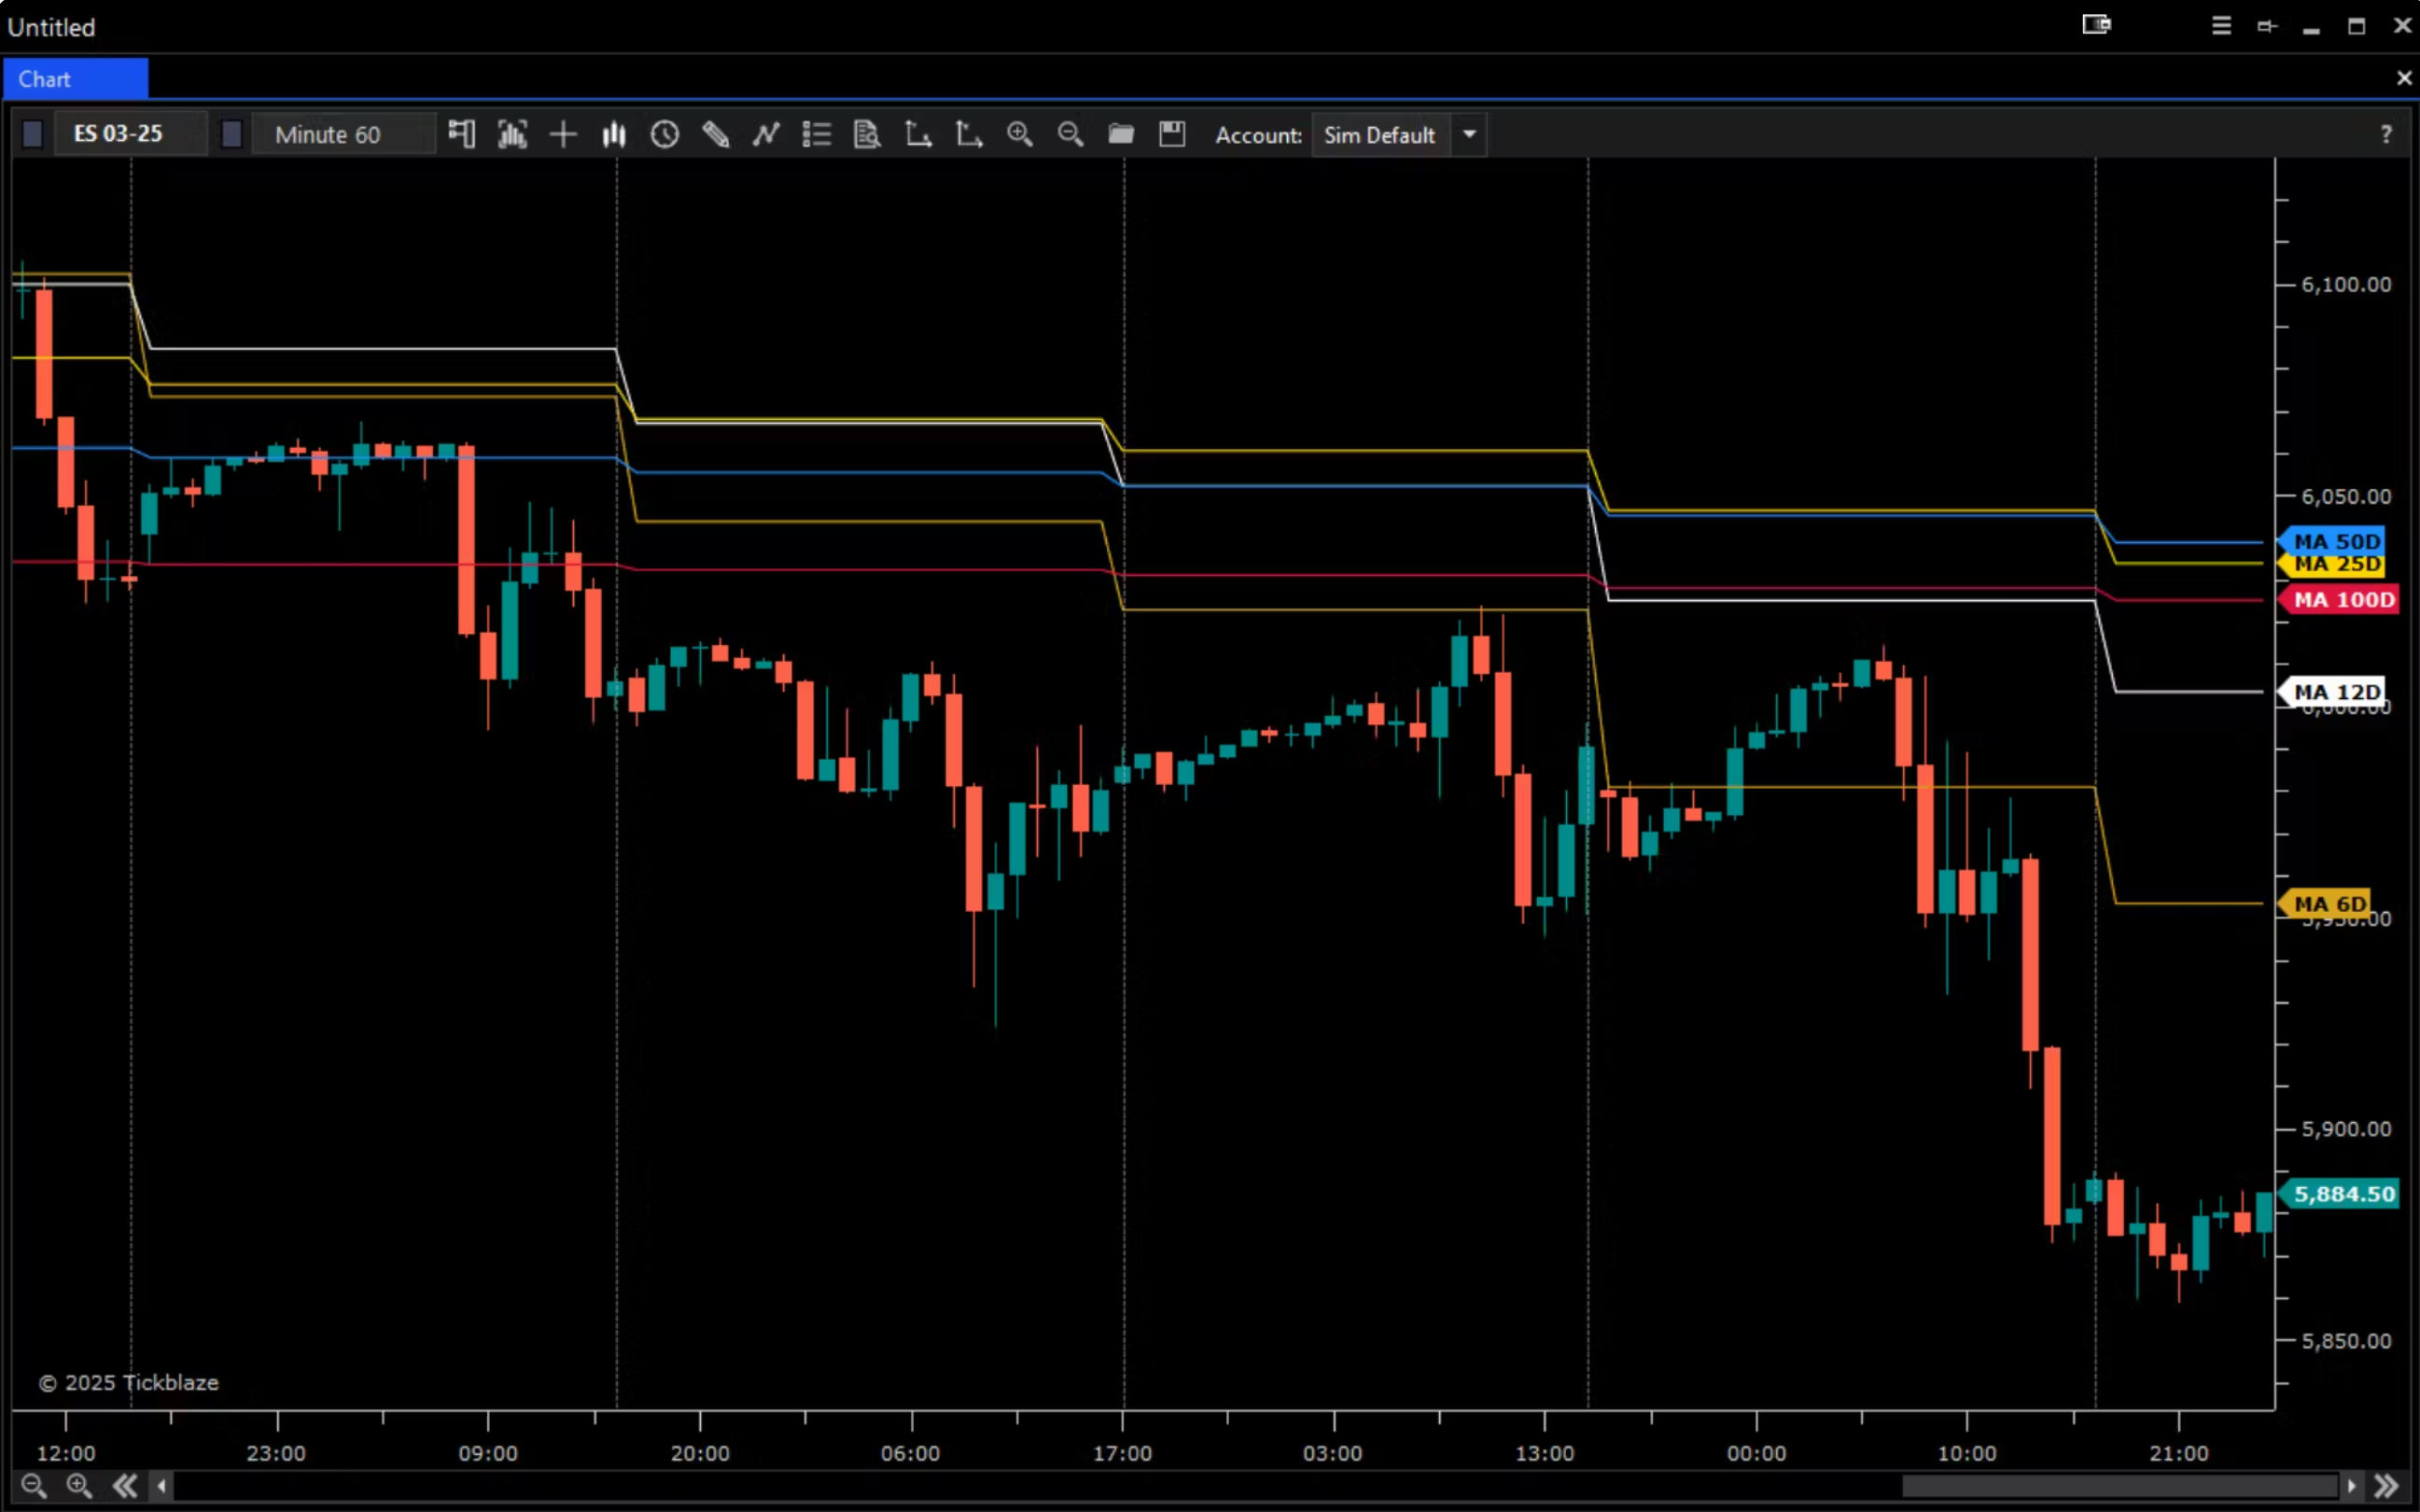
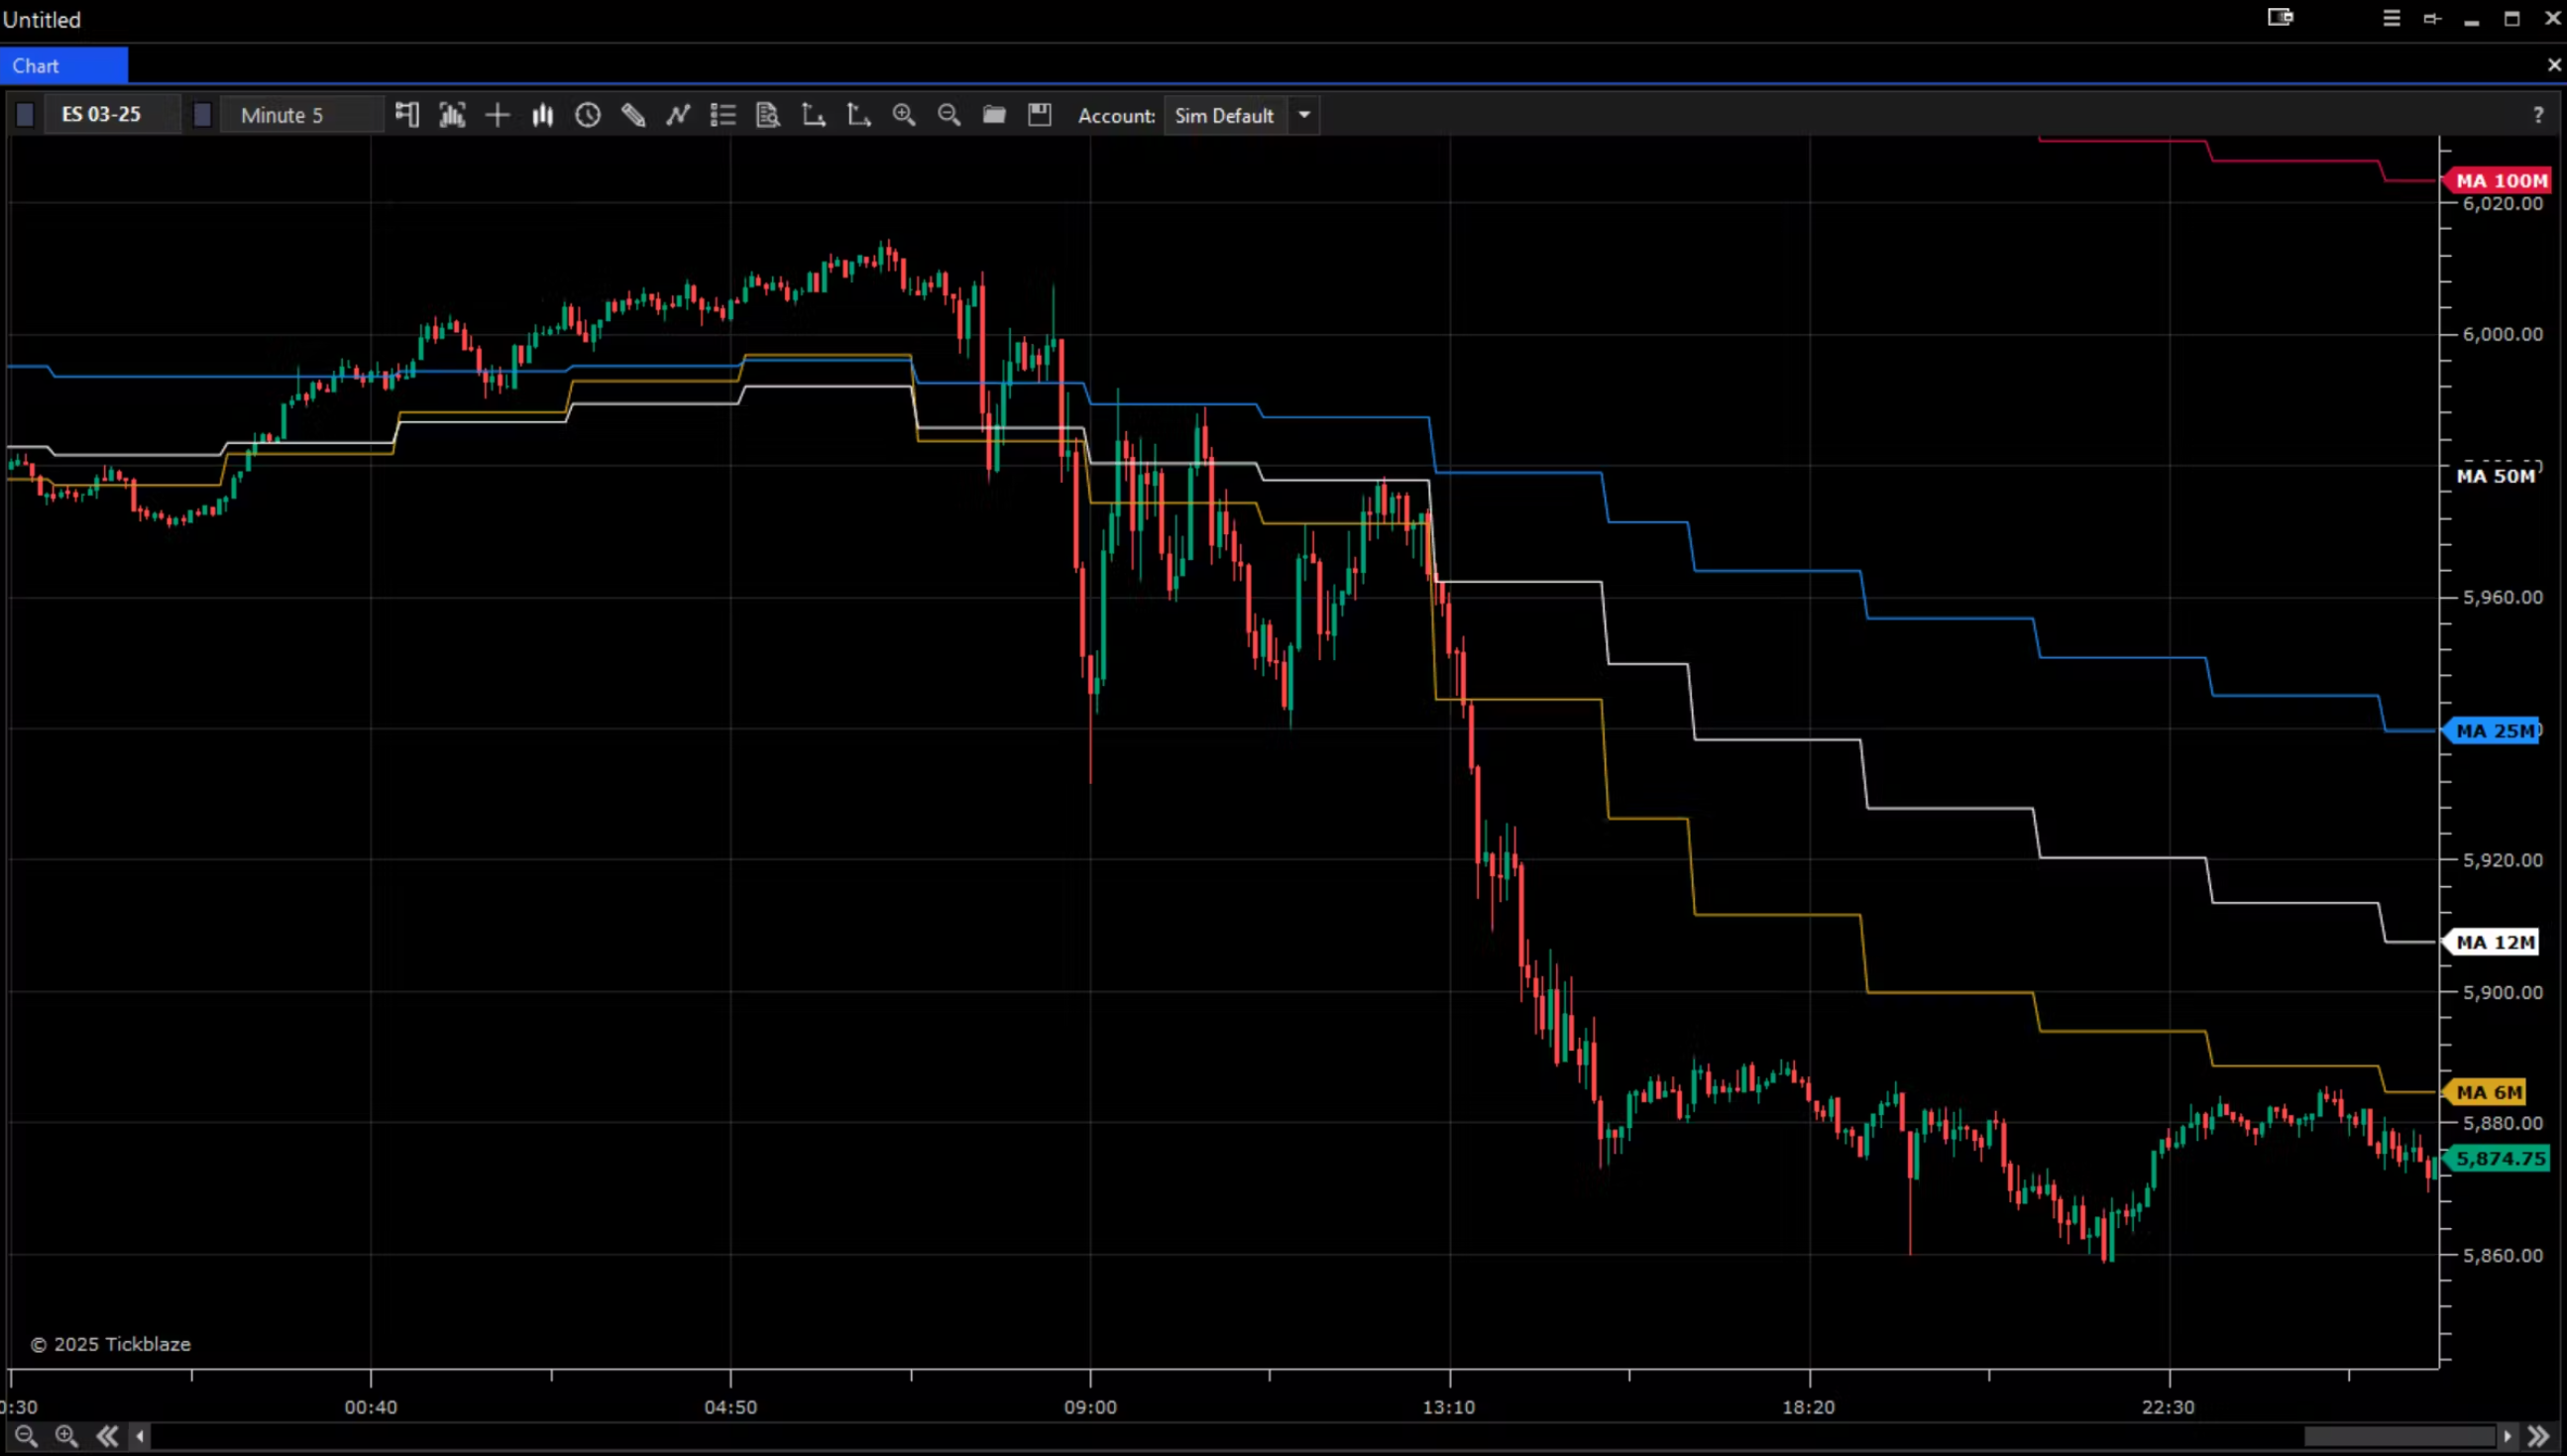
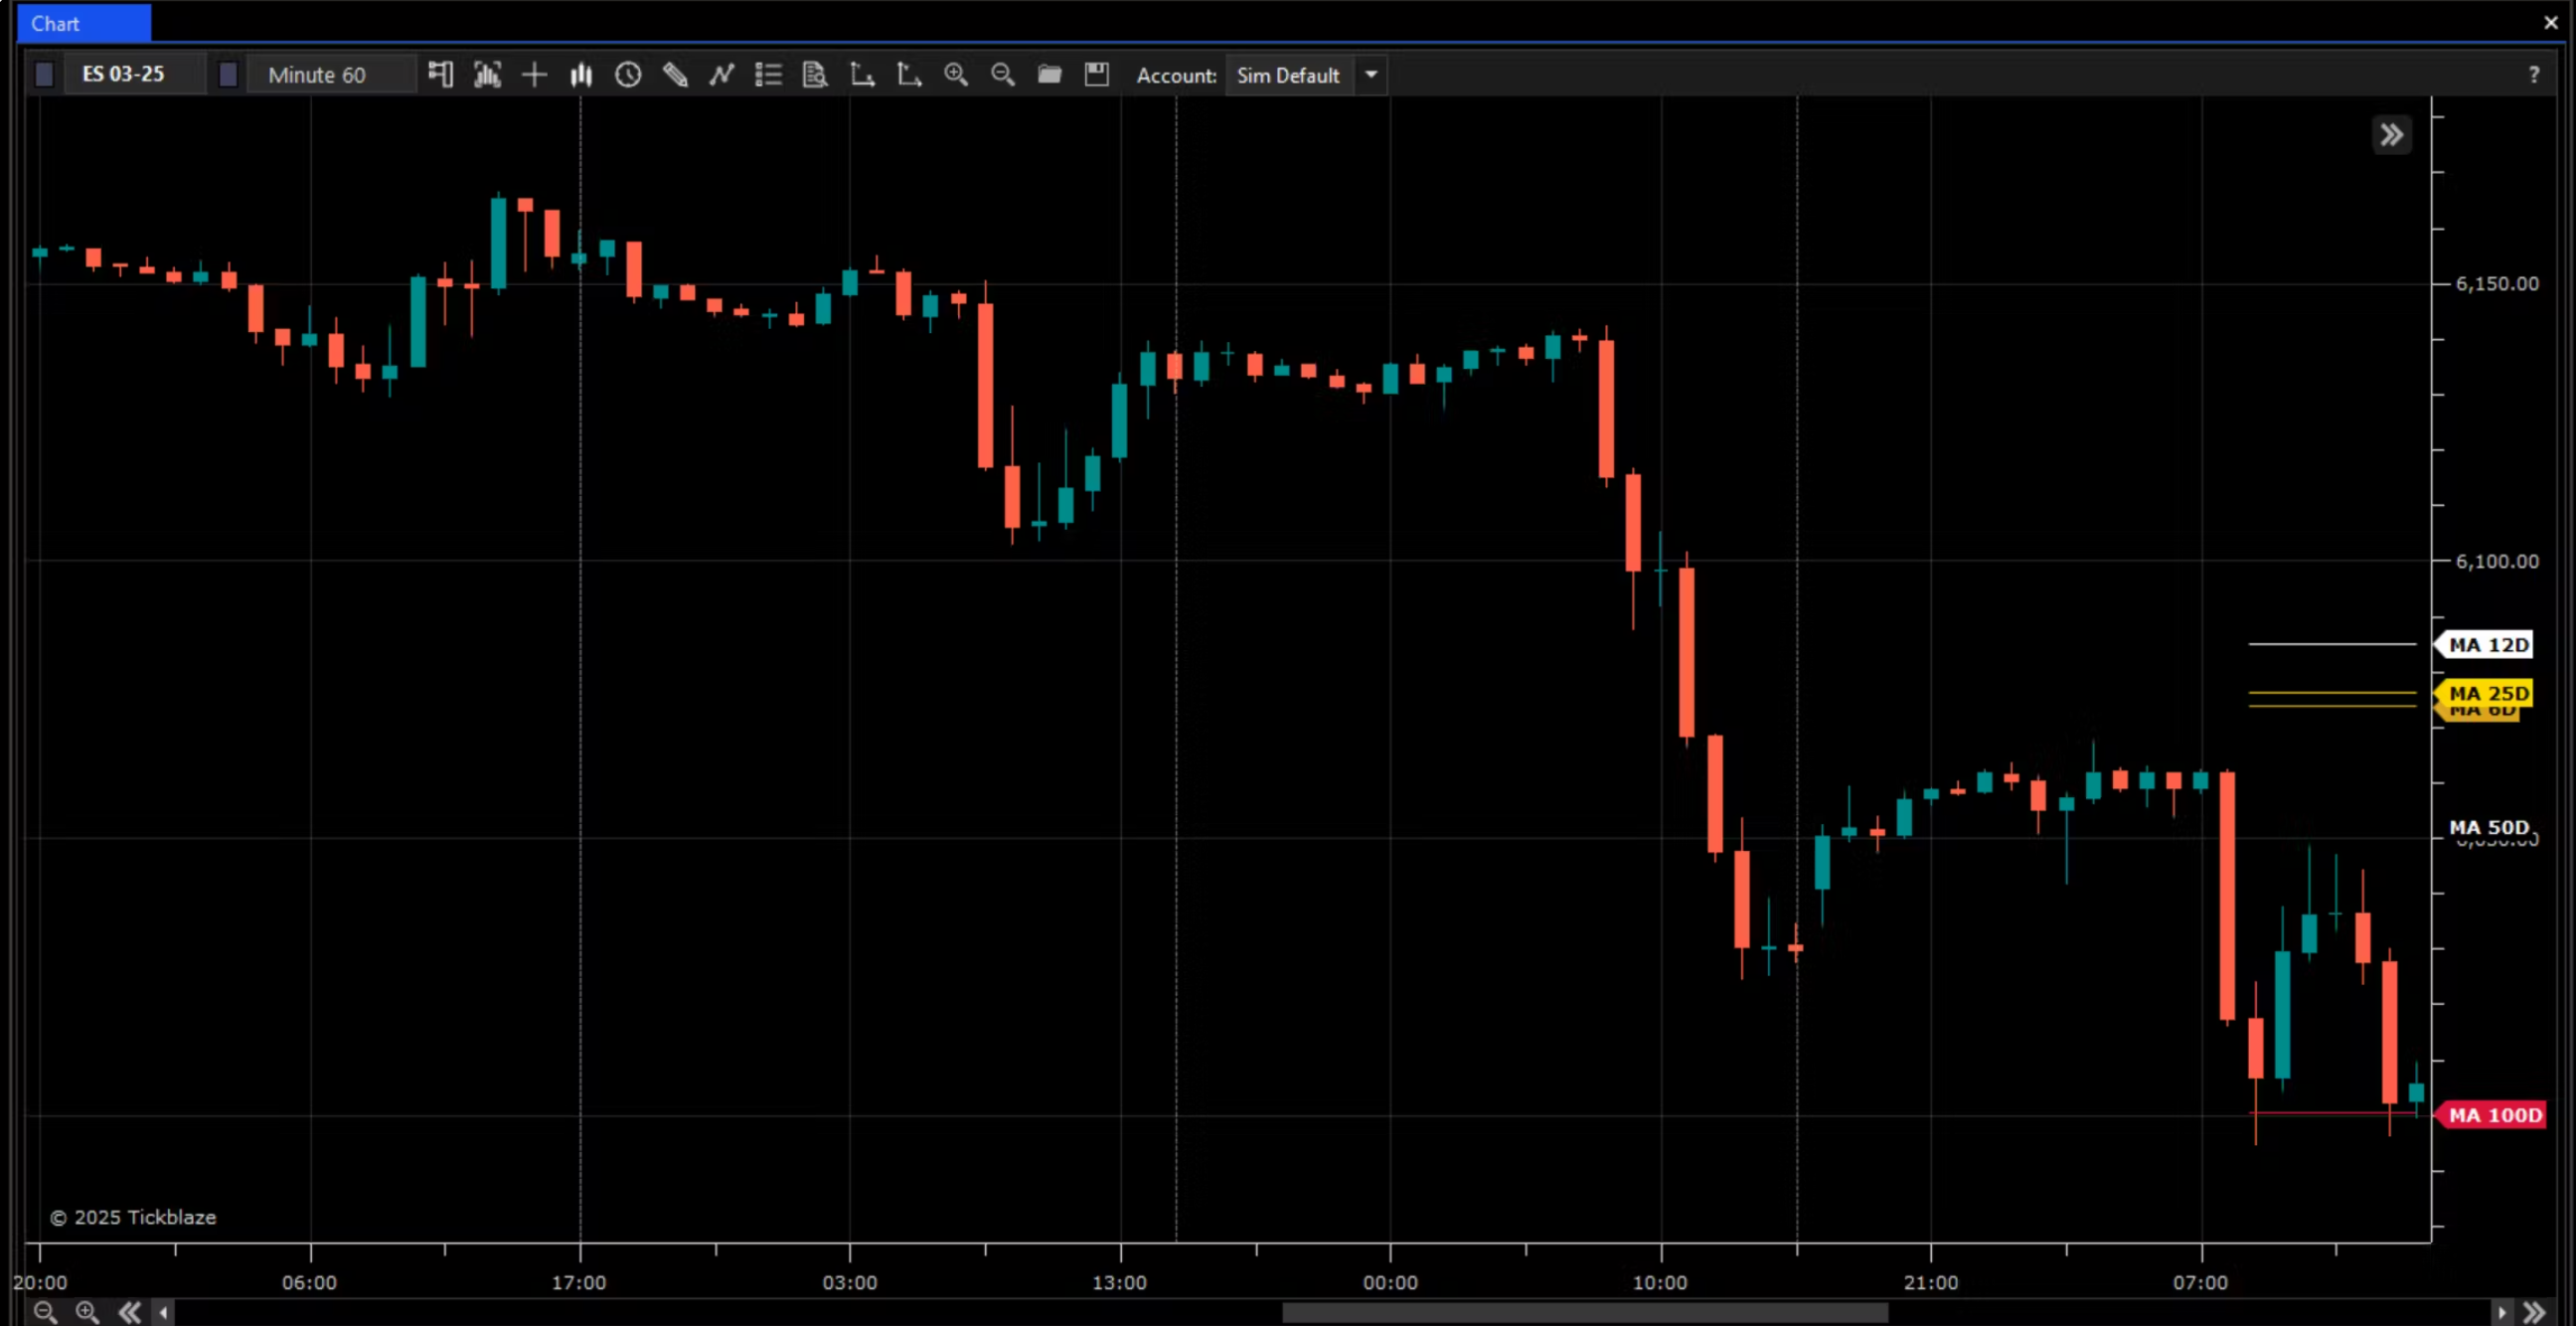
The HTF Averages indicator lets you plot moving averages from any higher timeframe directly onto your active chart—eliminating the need for multiple windows or tabs. You can display up to 7 custom moving averages, each with its own timeframe, lookback period, and style (SMA or EMA).
This tool is perfect for maintaining higher timeframe bias, identifying key support/resistance levels, and keeping your workspace clean by showing only what matters.