Sale!

3BP Liquidity

Original price was: $4,475.00.Current price is: $795.00.

Included With Purchase:

  • One-Time License
    :
    $1,495
  • Lifetime Updates
    :
    $995
  • VIP Live AMA + Strategy Training
    :
    $995
  • White Glove Install/Support
    :
    $495
  • User Documentation
    :
    $495
  • Total Value
    :
    $4,475


This product is built exclusively for the Tickblaze platform and requires Tickblaze to be installed. Don’t have access to Tickblaze? Download it here.


*This Tickblaze Marketplace Product requires a $295 annual maintenance fee after the first year. This fee is charged per user—not per purchase. For additional information, please click here.

3BP Liquidity Swings Indicator:

Want to add Compass?
 
You can bundle Compass with your 3BP purchase for a total of $1,295.
 
Simply select the Compass add-on when reviewing your cart at checkout.

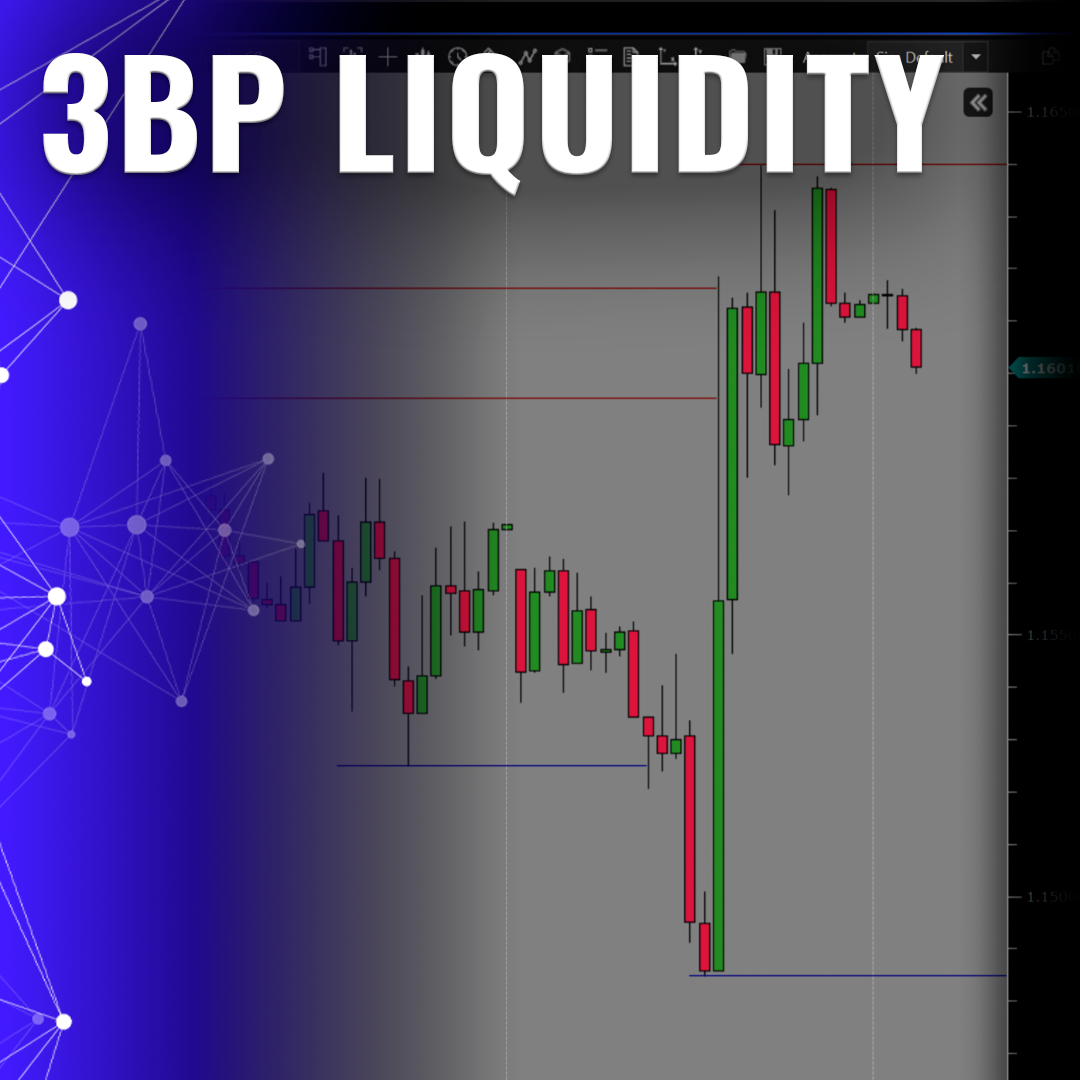
Eliminate the Noise and Trade Only the Strongest Support and Resistance Levels Based on HTF Liquidity Swings

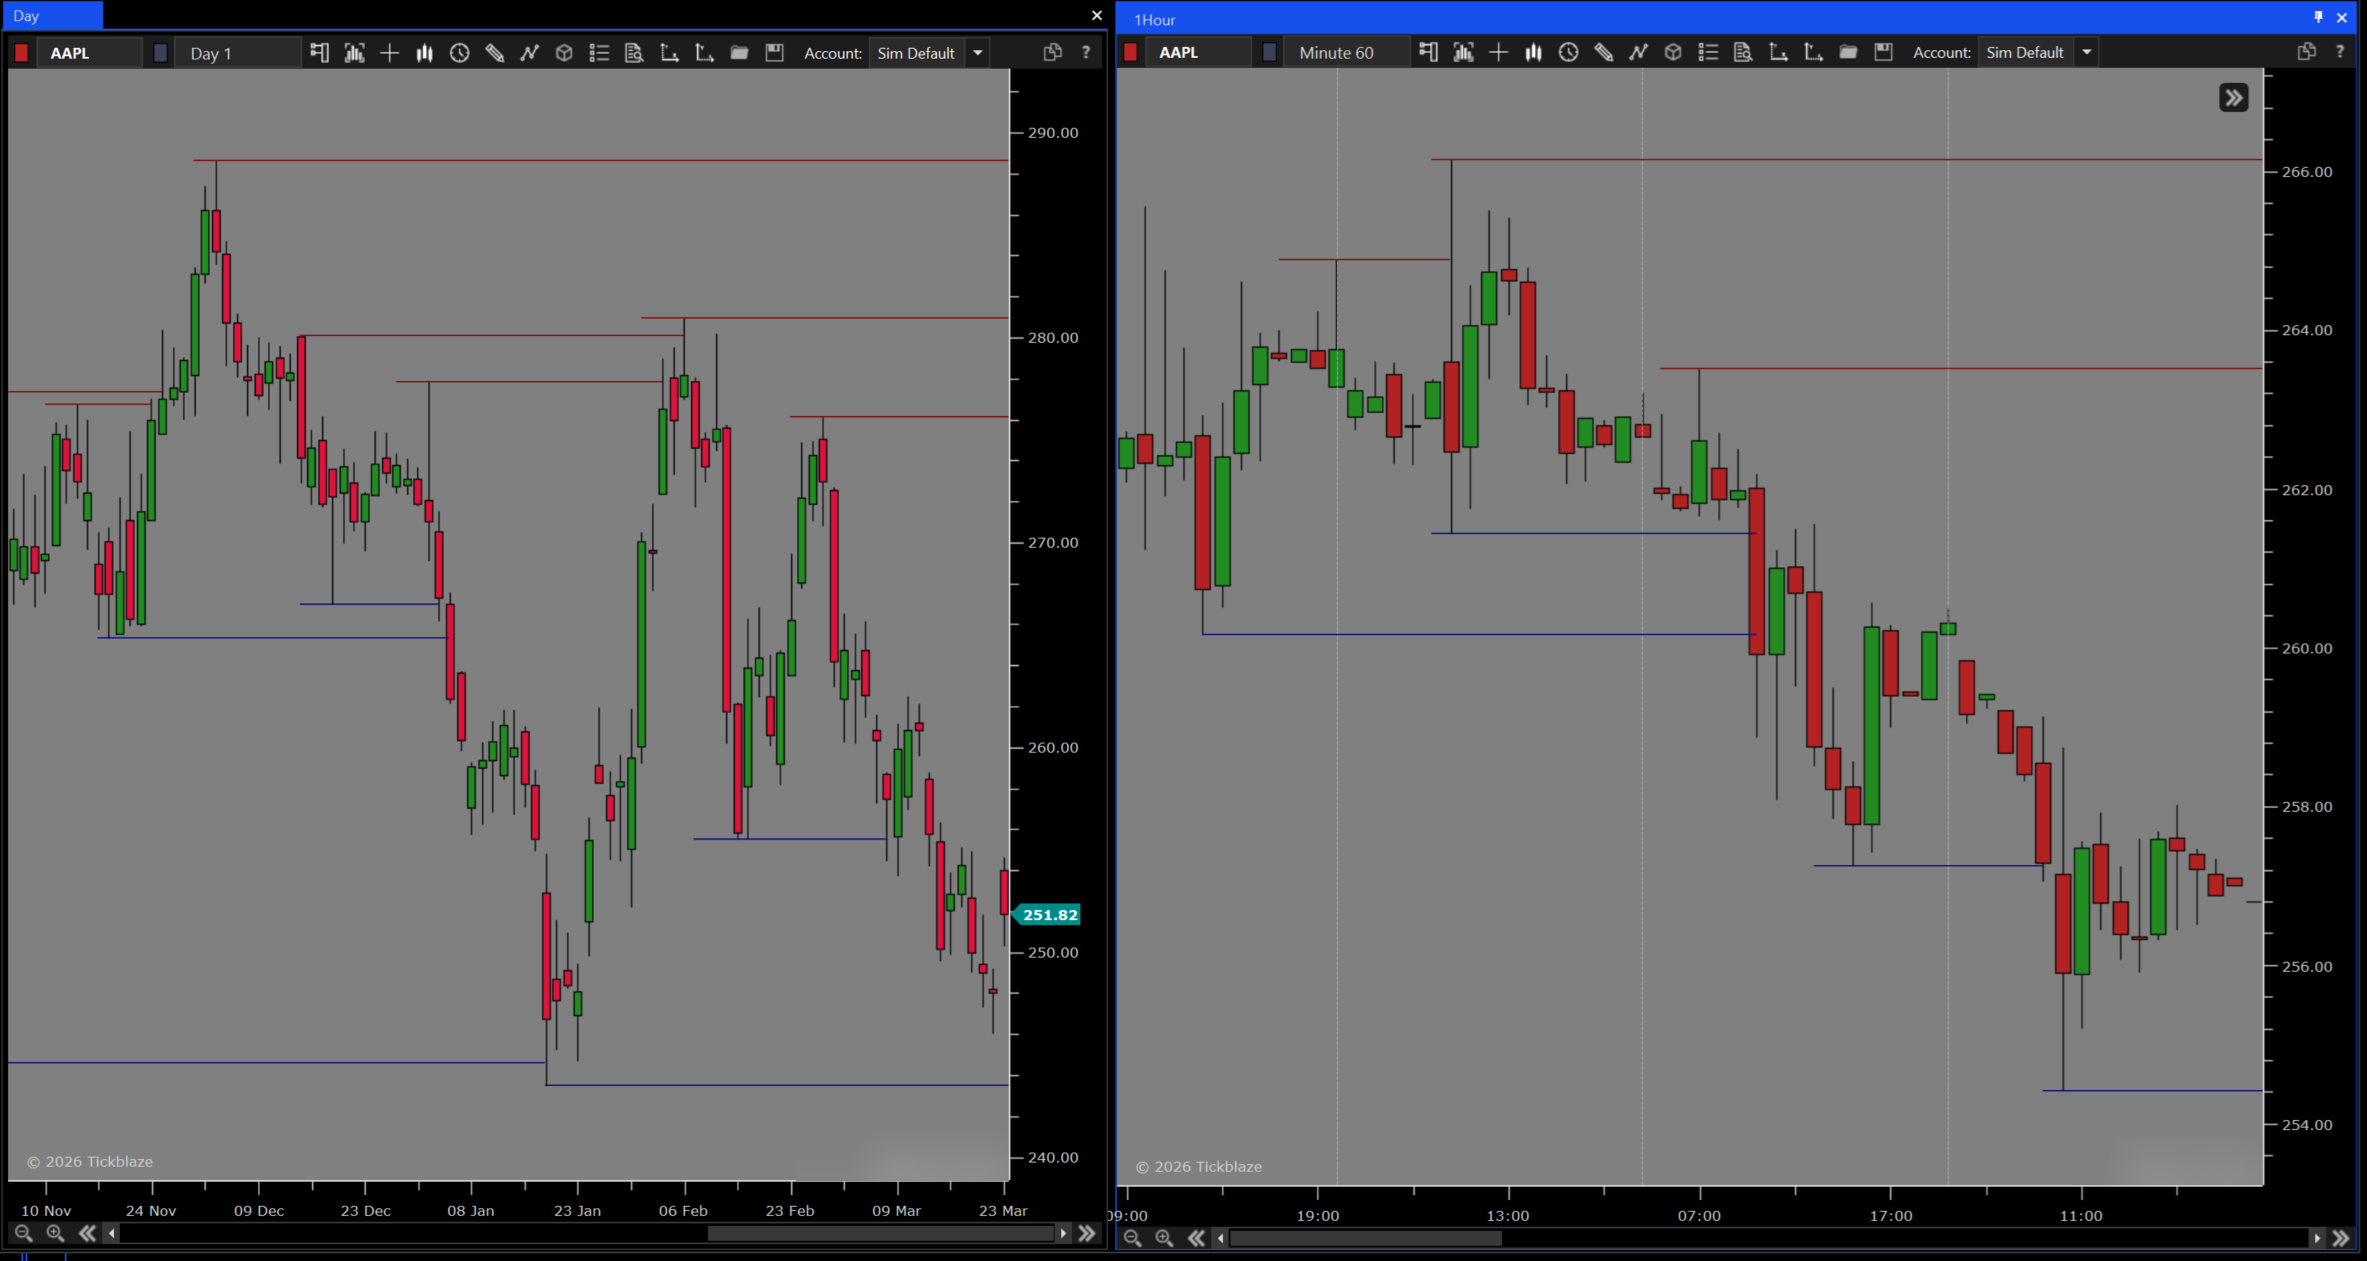
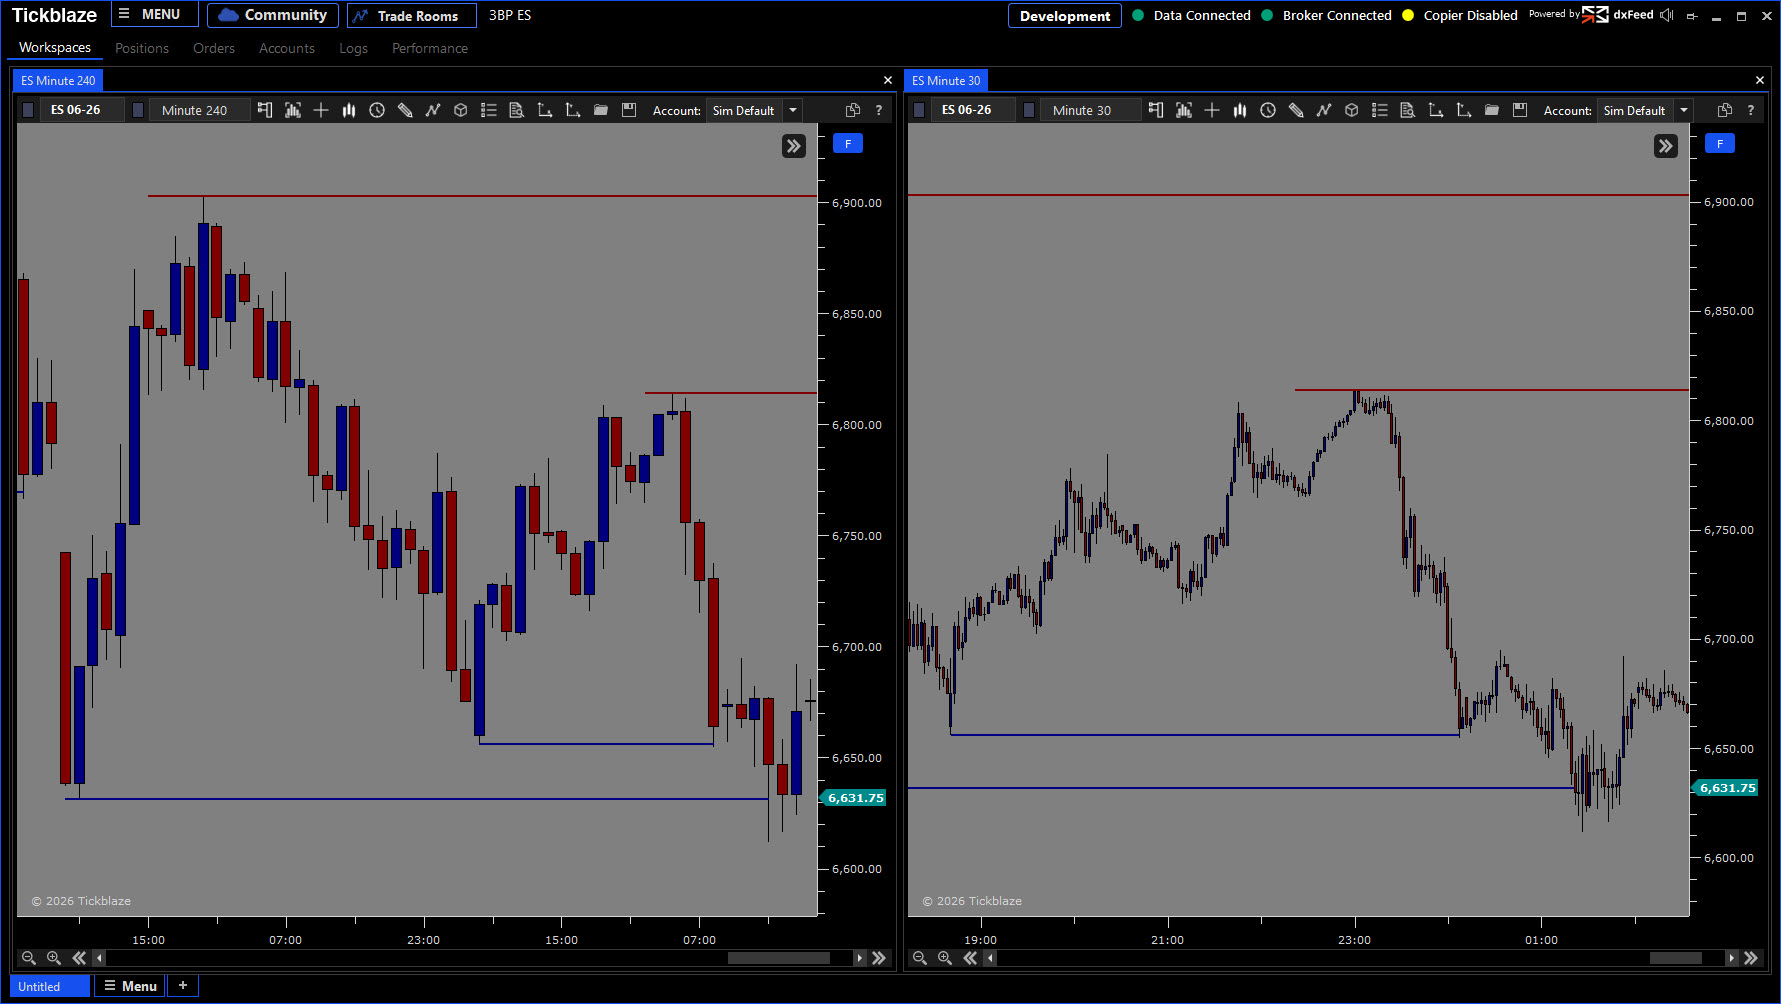
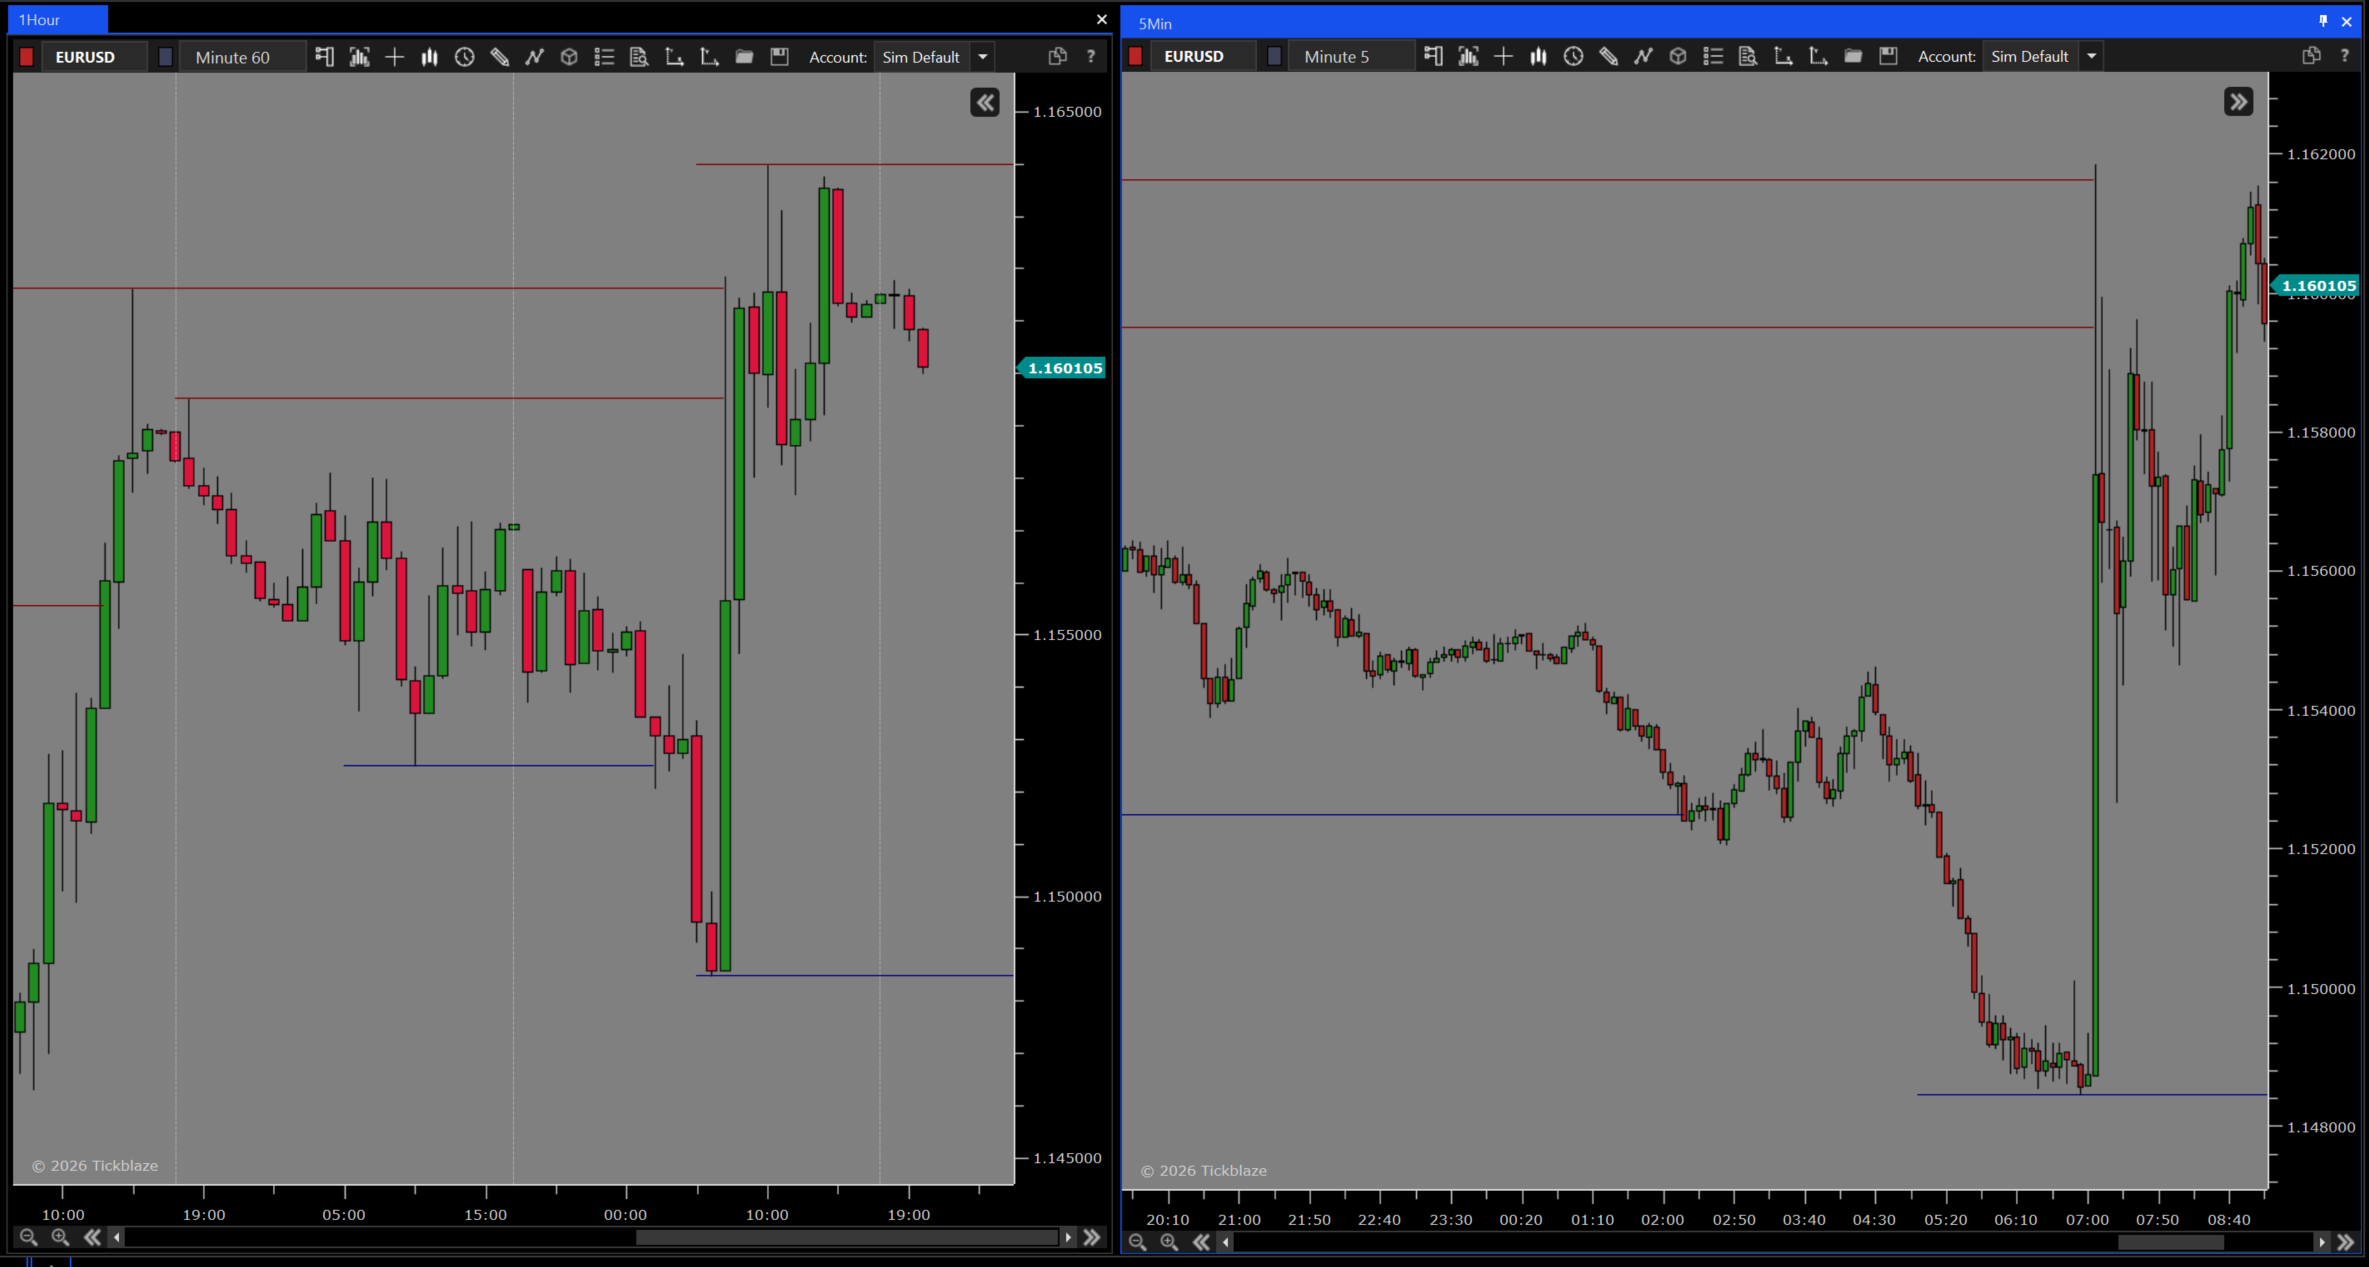
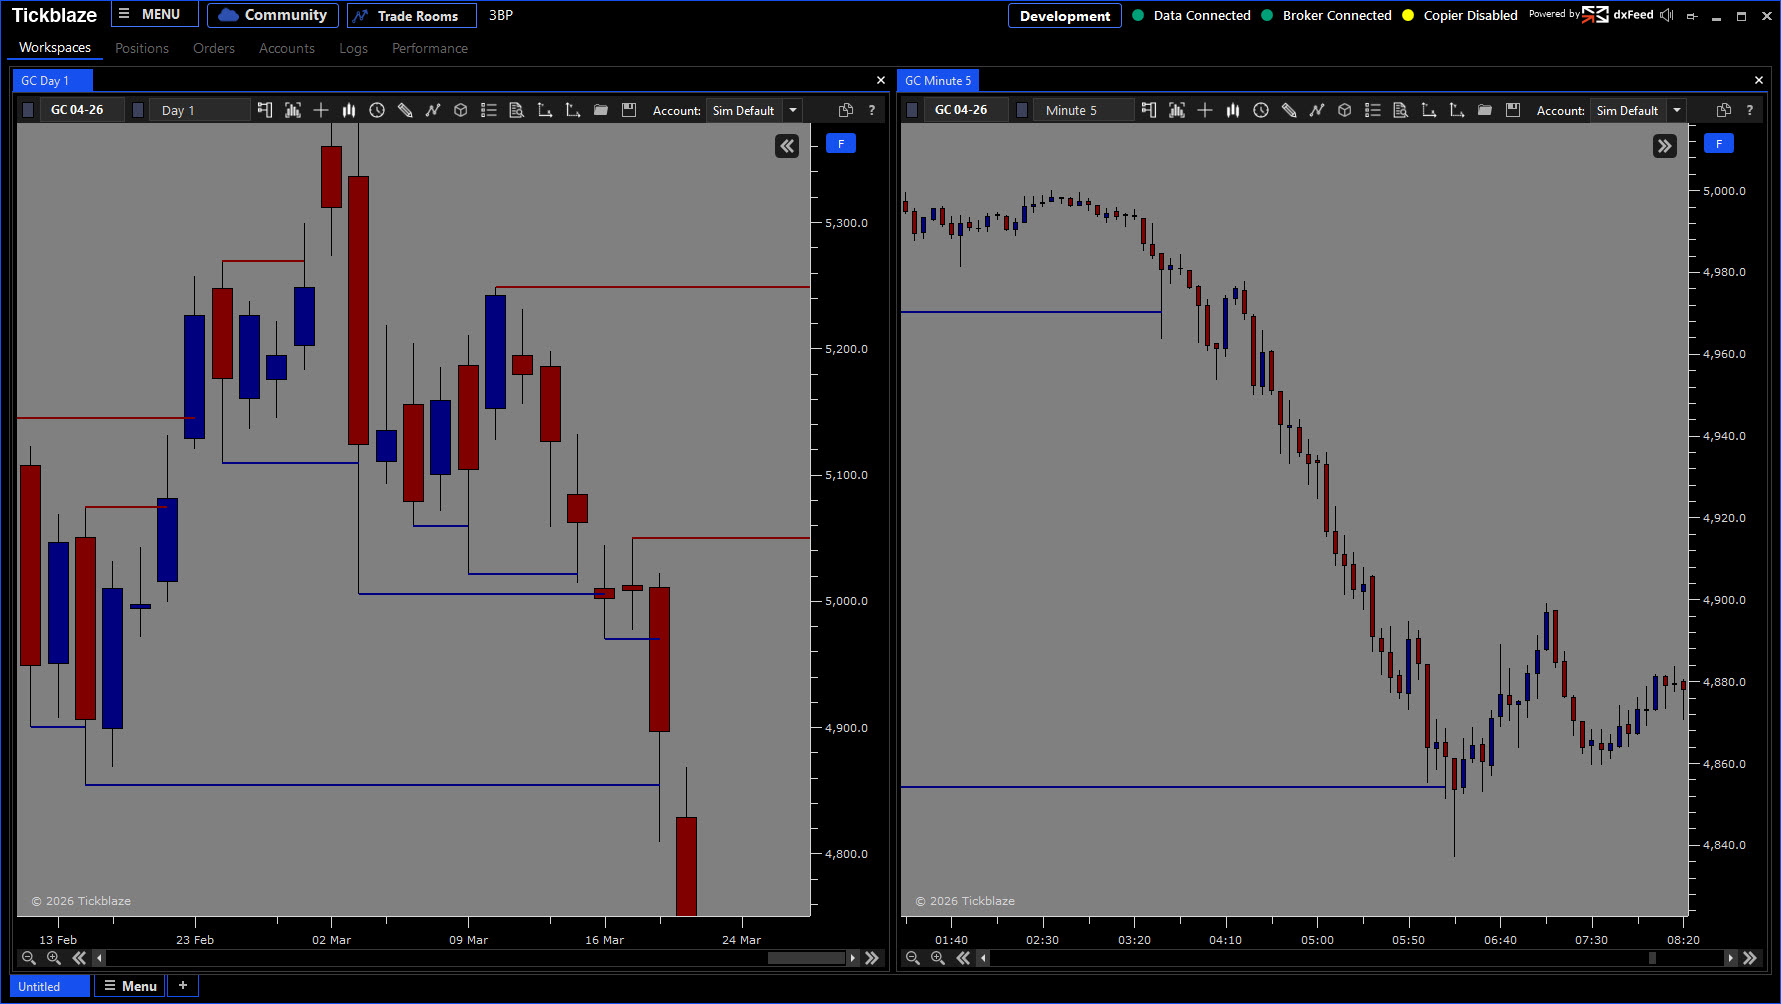
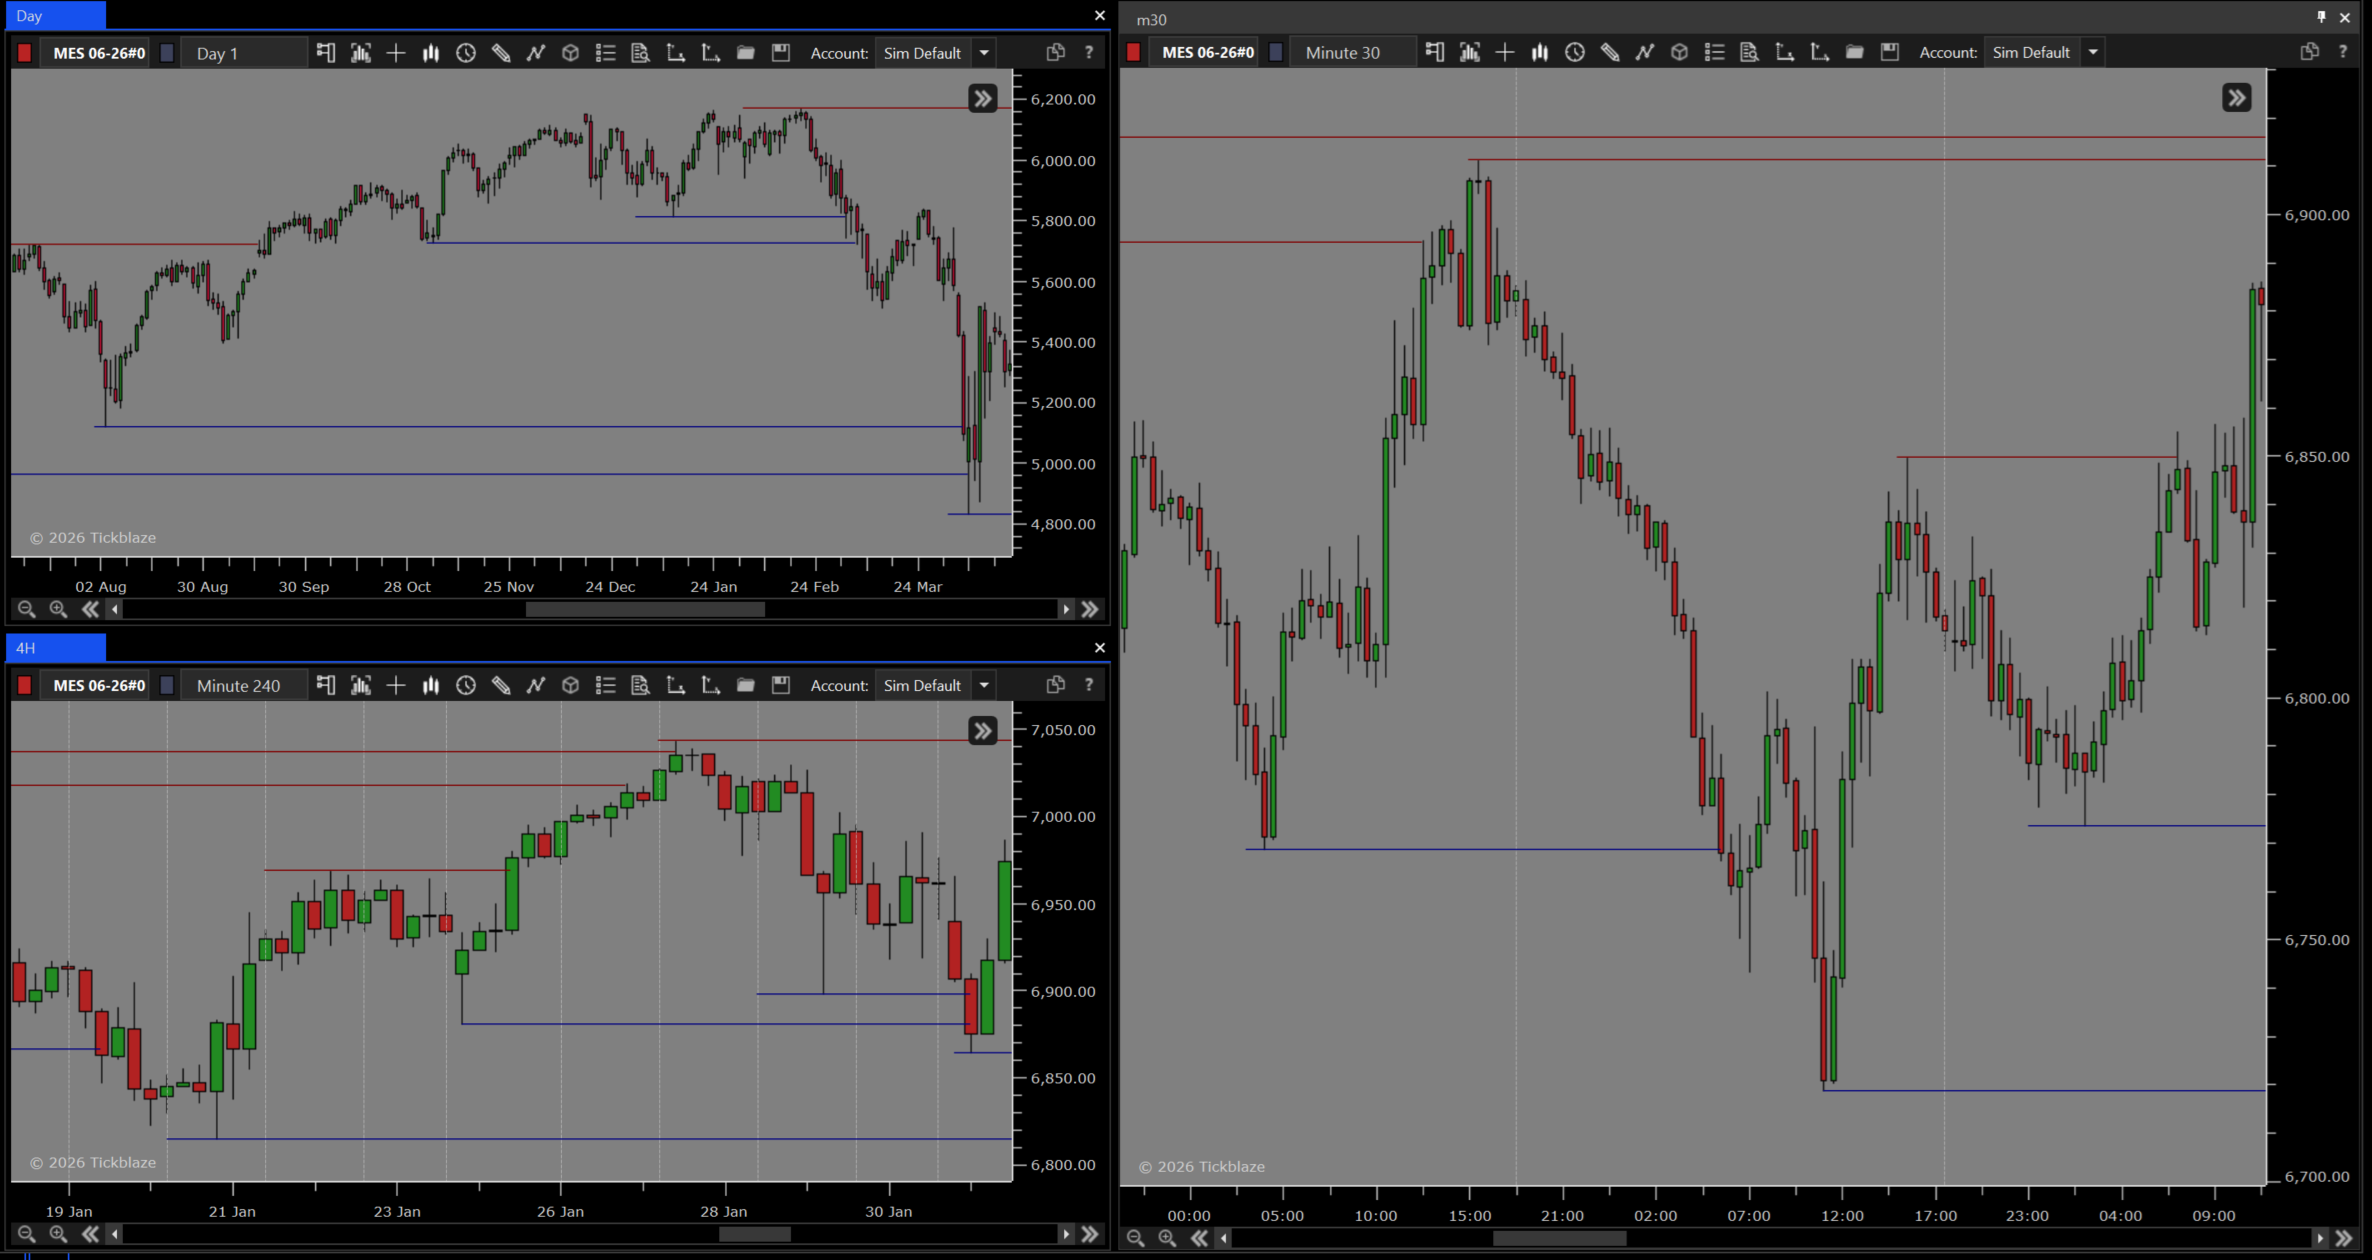
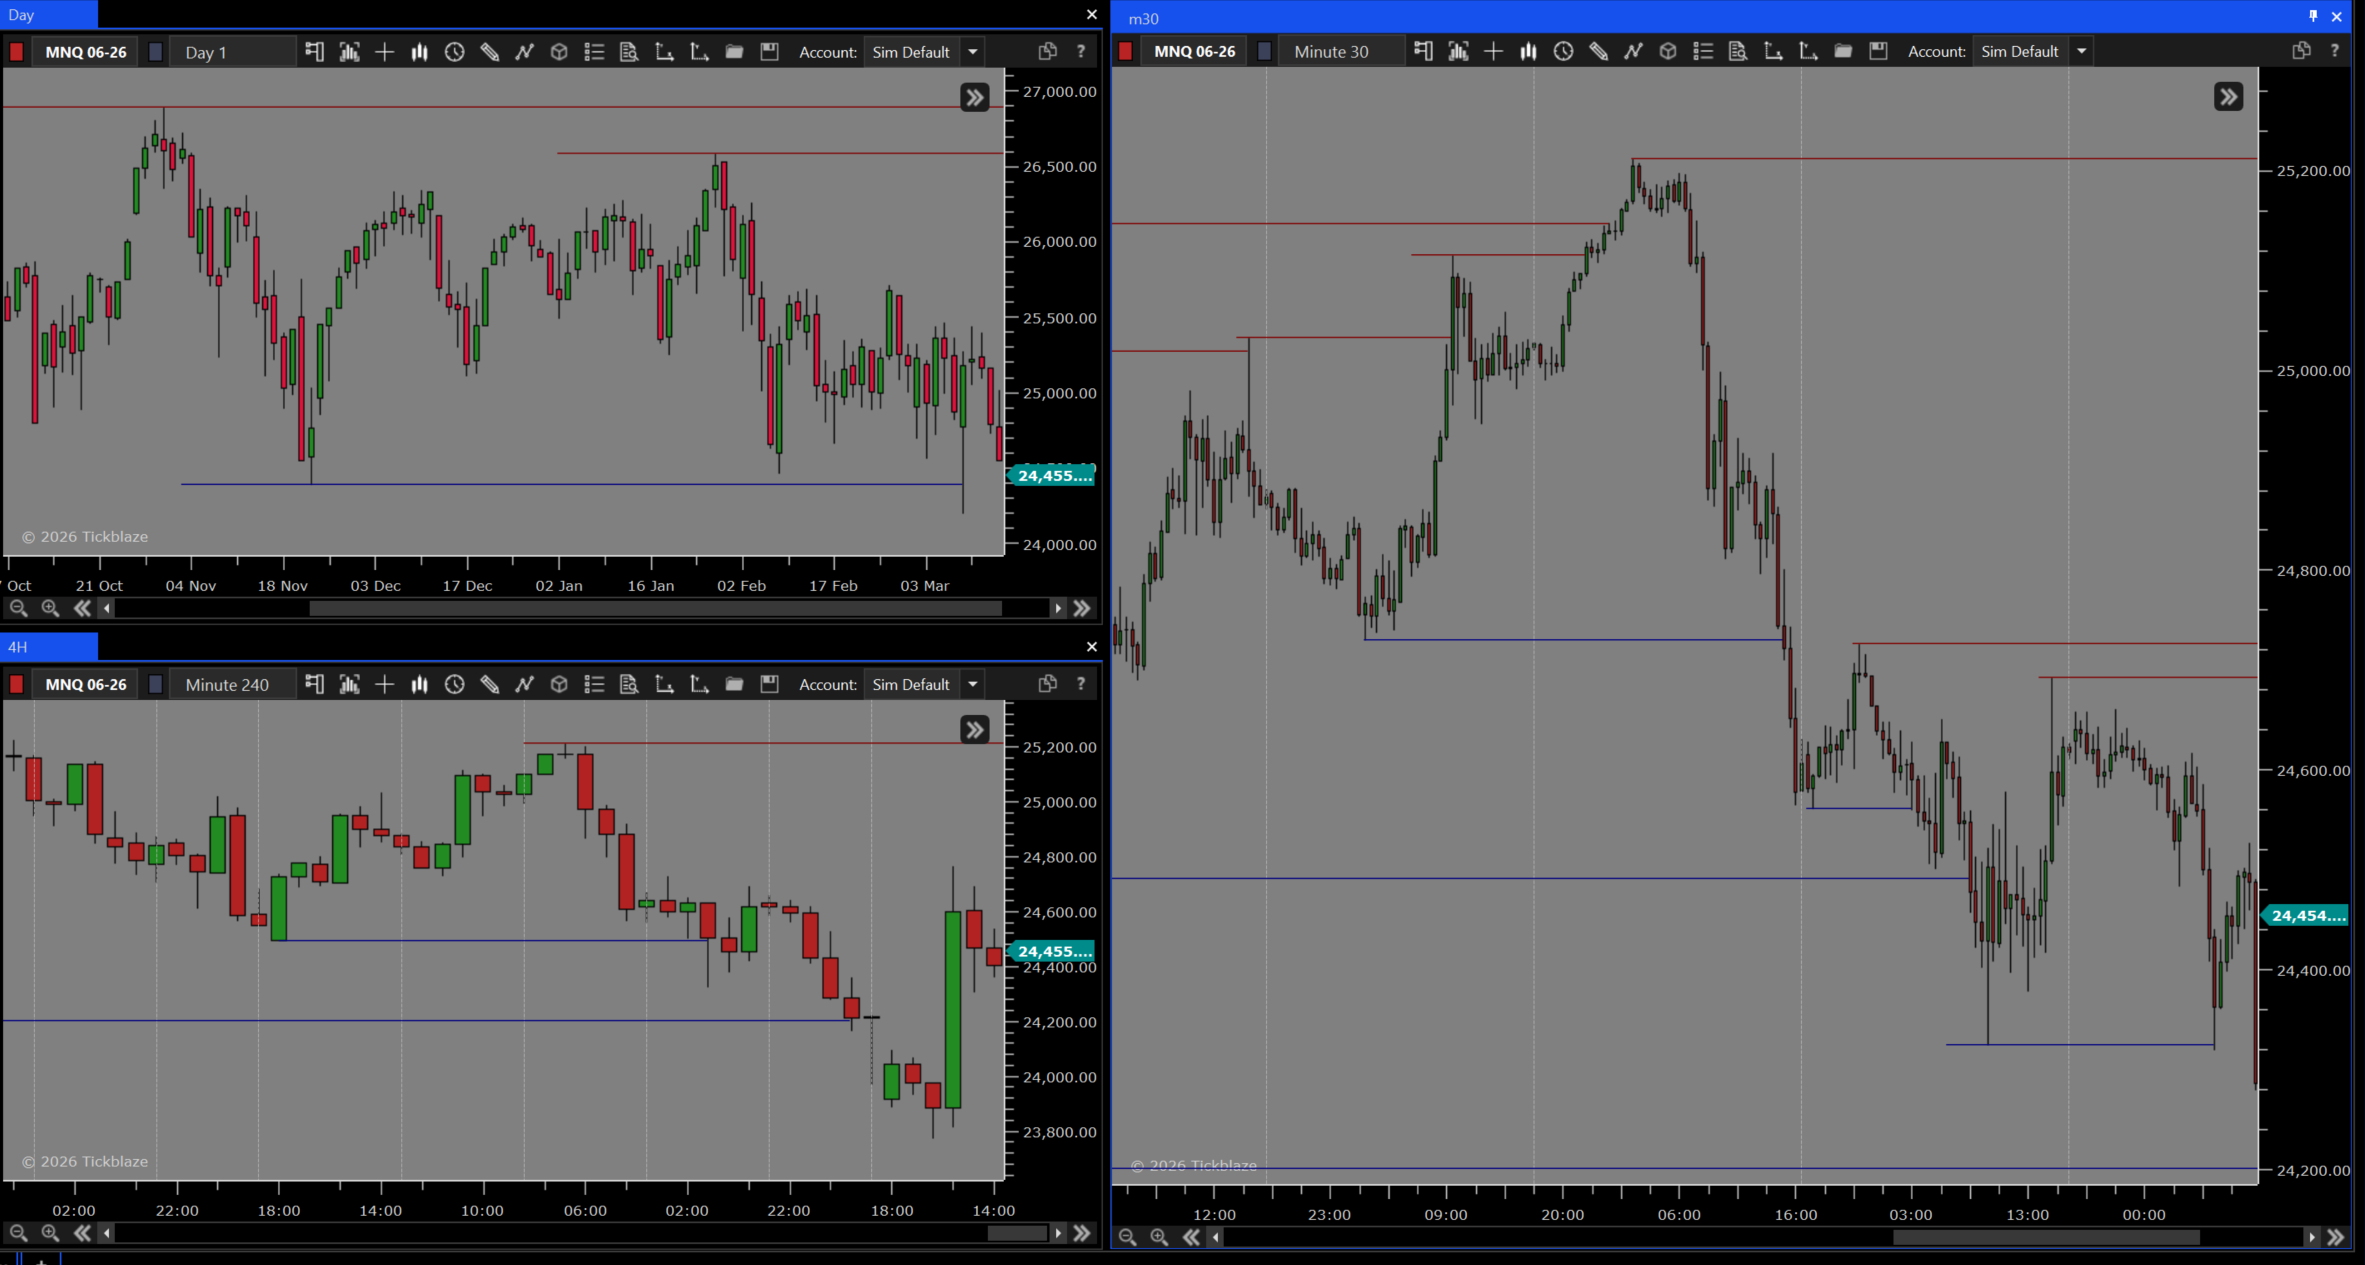
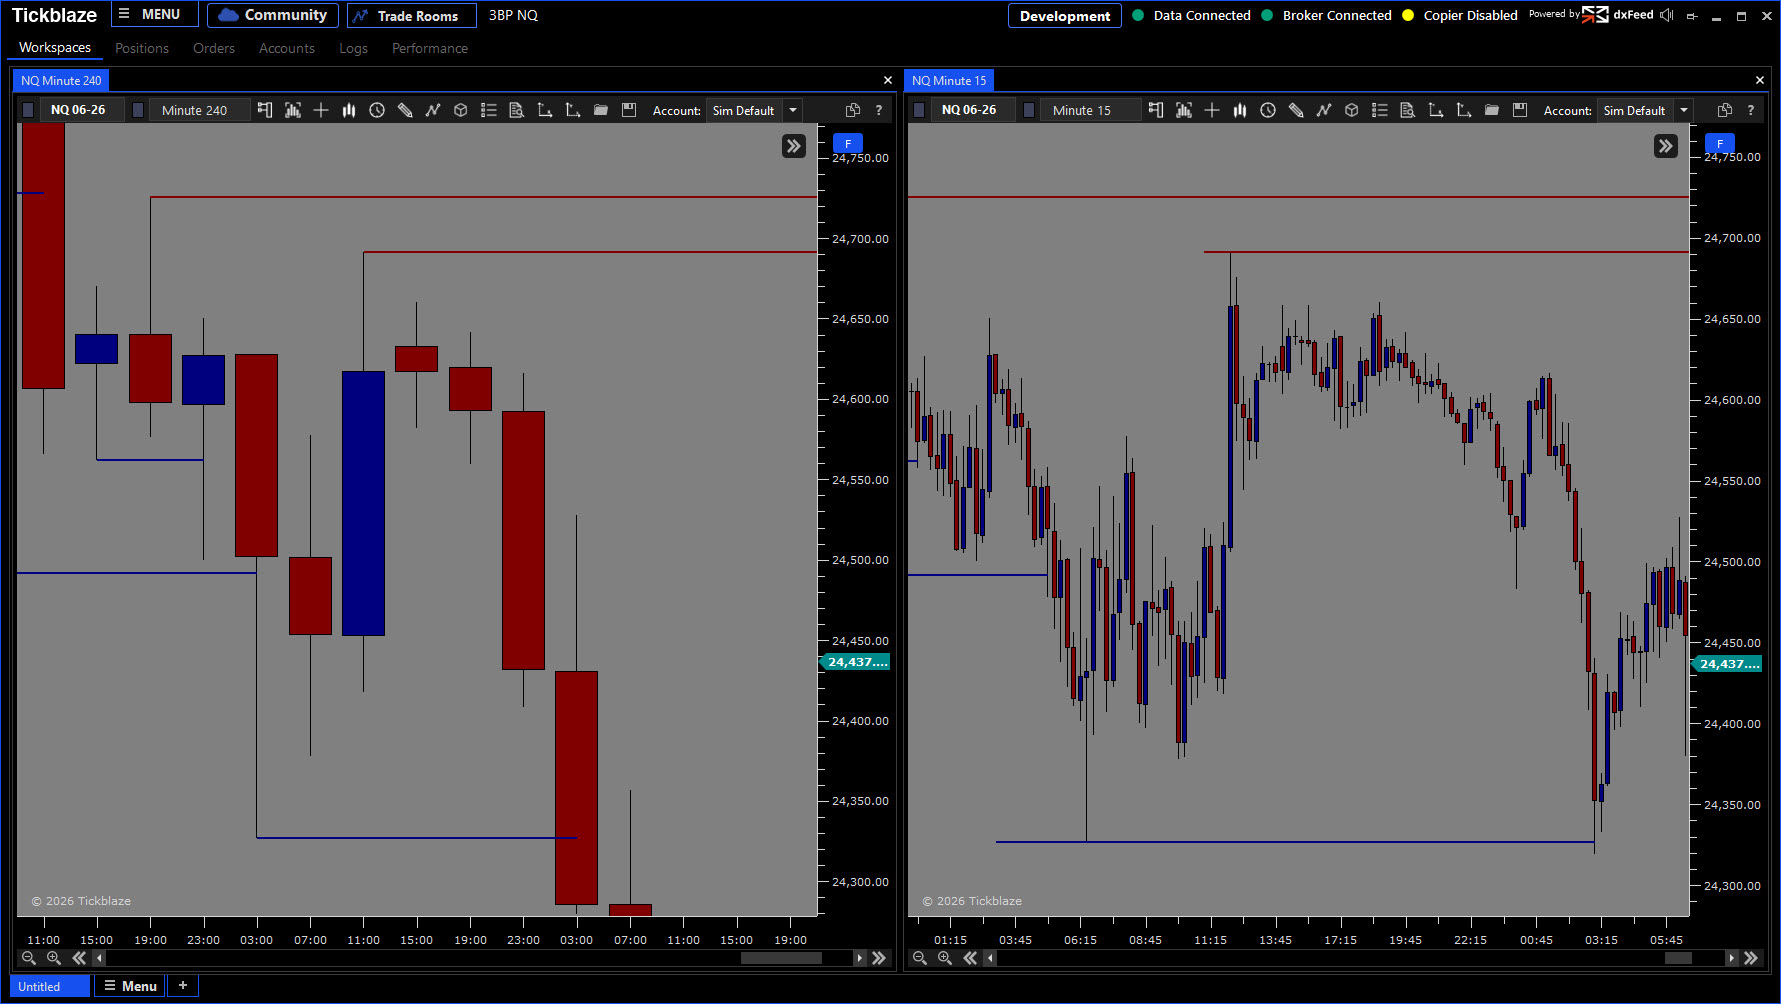
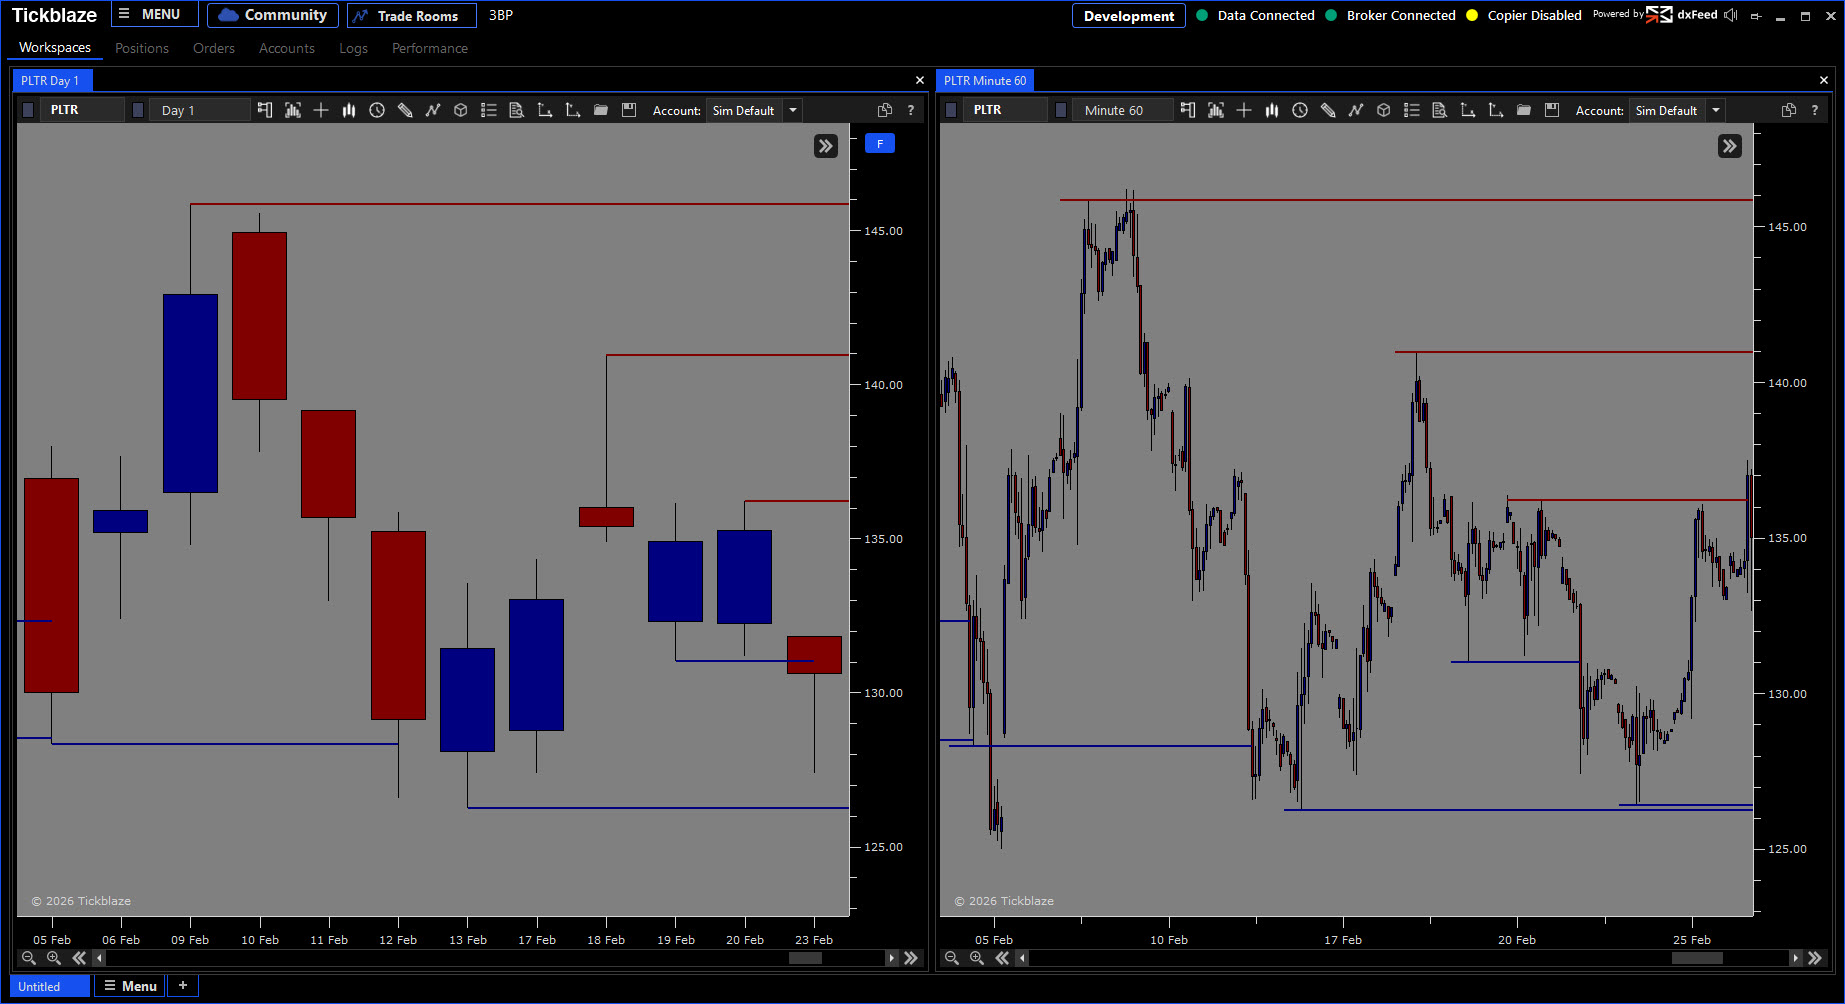
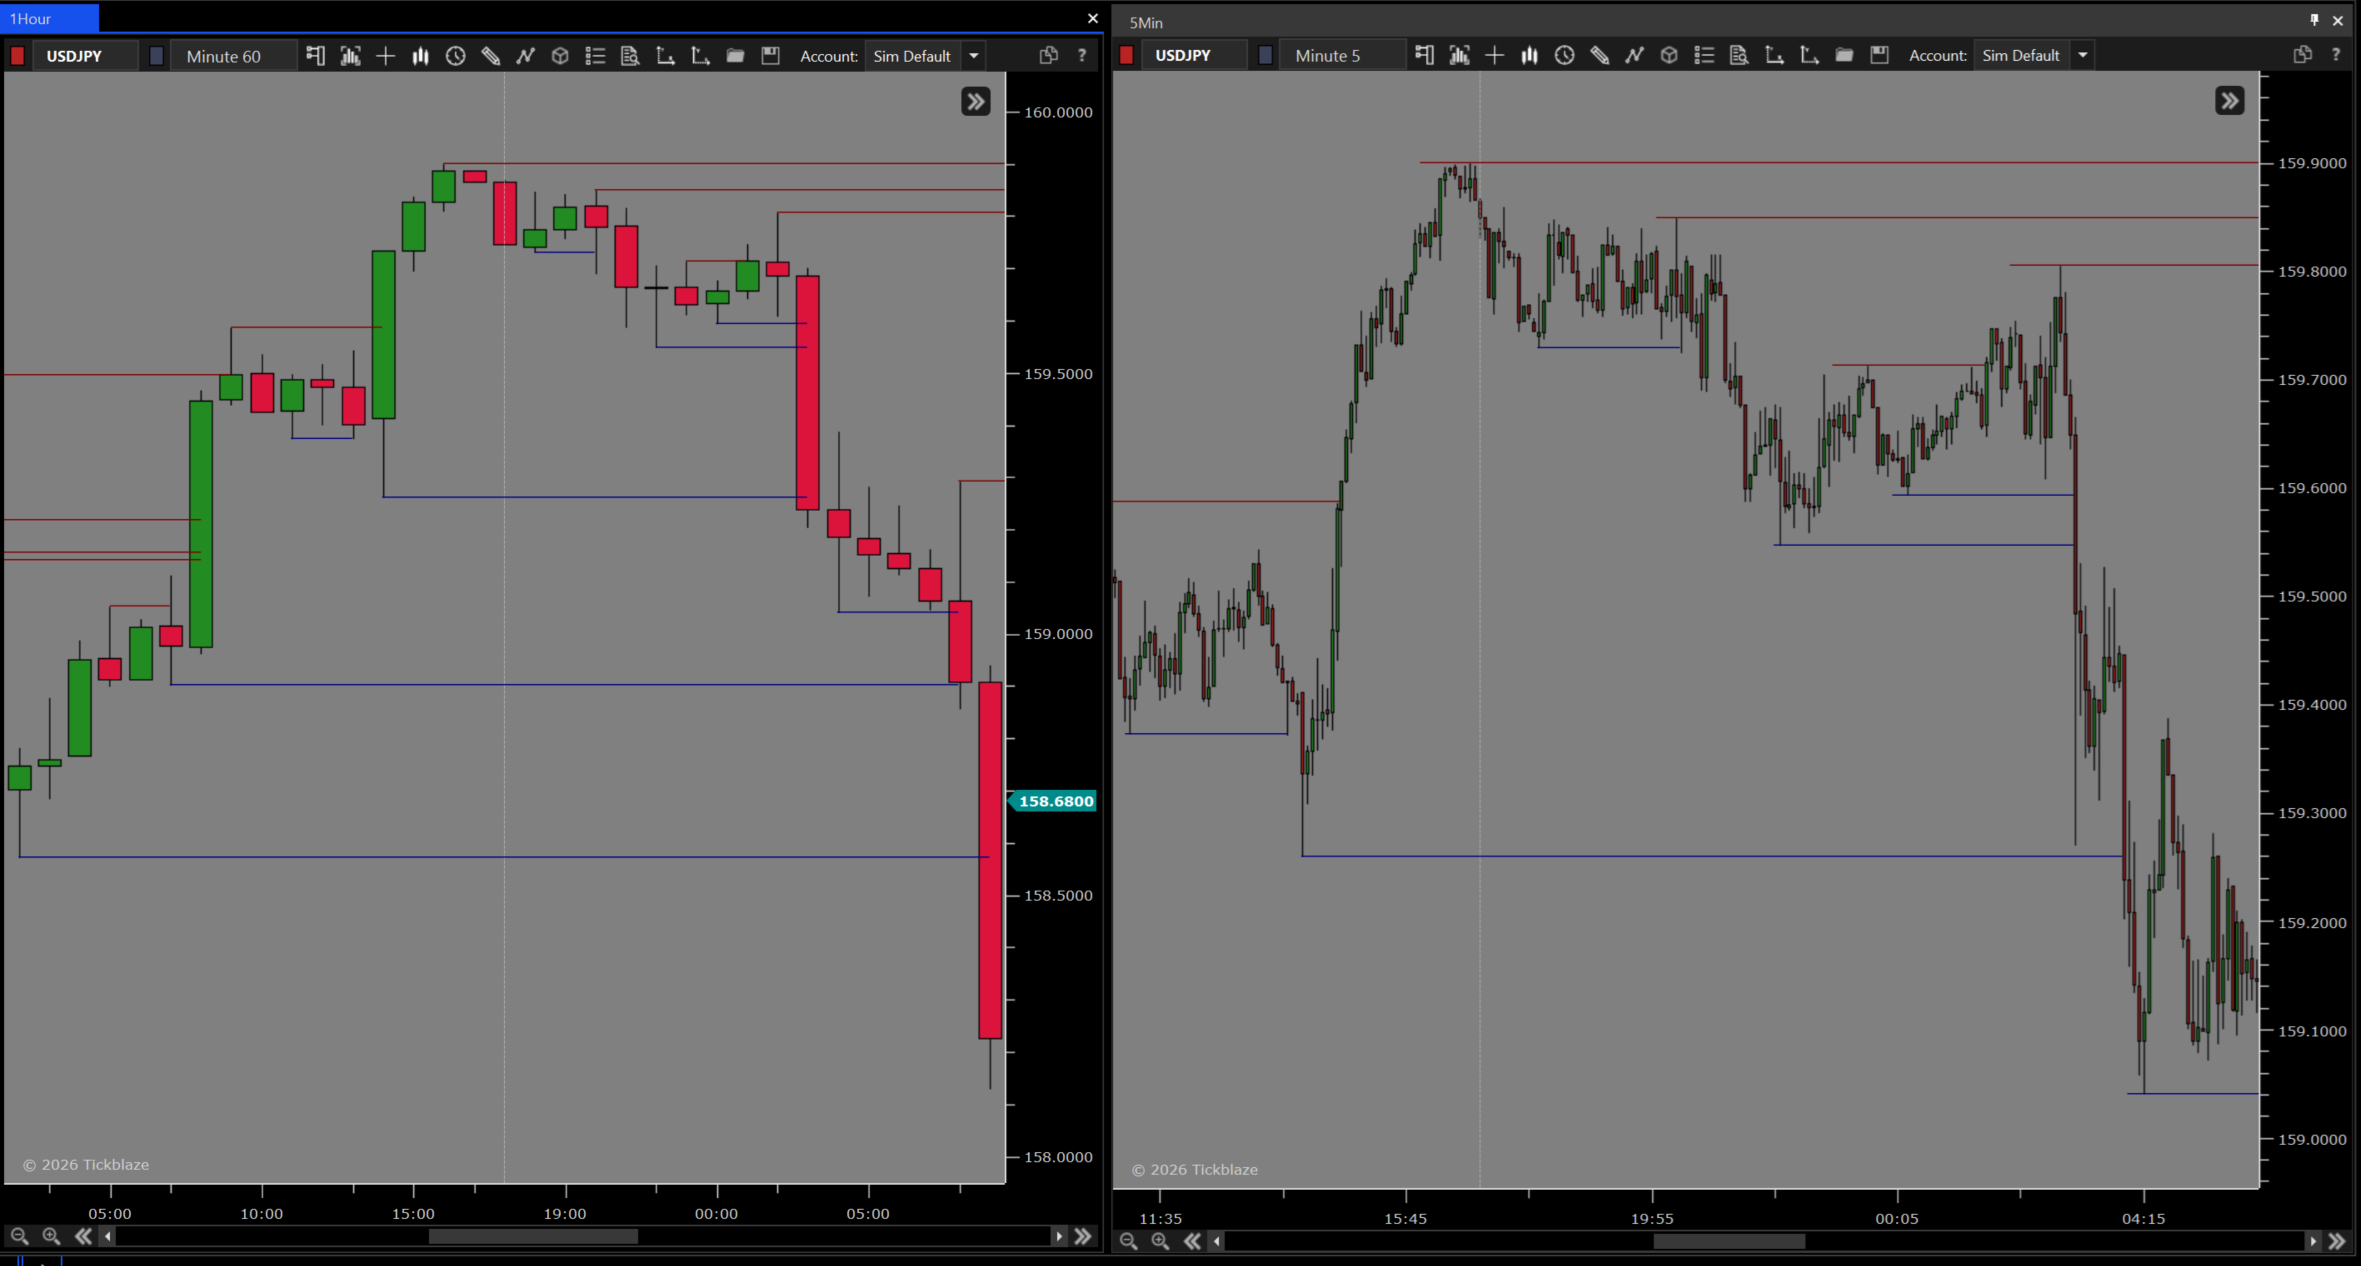
The 3-Bar Pattern (“3BP”) Liquidity Swings Indicator shows you where the strongest Support and Resistance levels are located. By focusing on higher timeframes to look for 3 bar rotation patterns, the 3BP tool eliminates the noise by focusing on institutional timeframes where the true drivers of market price action play out. Any price rotation on daily, weekly or even monthly timeframes carries much more significance than a local high or low on a 5 minute trading chart.

You define the higher timeframe (from Monthly all the way down to 1 Hour) and the software automatically displays the HTF Liquidity Levels on your short term trading chart. Each level extends forward until price trades through it, saving you from worrying whether or not a level that you see is still valid. With the 3BP indicator in your arsenal, you can trade like a pro knowing the exact prices where stop loss orders, breakout entries, and institutional interest naturally cluster.

WHY TRADERS LOVE IT:

  • Liquidity Mapping: See the exact price levels where stops and orders cluster, before the market sweeps them
  • Multi-Timeframe Structure: Apply Monthly, Weekly, Daily, 12Hour, 4Hour or 1Hour swing levels onto your trading chart for instant context
  • Zero Lag: Based entirely on price structure, so no moving averages, no oscillators nor recalculation delay
  • Self-Cleaning Chart: Lines automatically terminate when price breaks through, so only active levels remain on screen
  • Works on Any Market: Futures, forex, stocks, crypto: anywhere a 3-bar swing forms, liquidity sits at the extreme
  • Dead Simple Setup: Pick your timeframe, choose your colors, and the indicator does the rest, no parameter tuning required

CORE FEATURES:

  • Automatic 3-Bar Pattern Detection identifying swing highs (bearish) and swing lows (bullish) with no manual input
  • Horizontal Liquidity Lines plotted at the pattern extreme and extending until price breaks through
  • 6 Higher-Timeframe Options: Monthly, Weekly, Daily, 12 Hour, 4 Hour, and 1 Hour
  • Same-Timeframe Mode for traders who want pattern lines drawn directly from the chart’s own bar data
  • Separate Bullish and Bearish Line Styling with independent color, thickness, line style, and opacity controls
  • Auto-Termination on Break: lines disappear the moment price invalidates them, keeping your chart clean
  • Lightweight Performance, minimal processing overhead so your charts stay fast even with multiple instances

SOLVES THESE COMMON MISTAKES:

  • Trading Blind In to Liquidity Pools because you couldn’t see where stops were clustered above or below price
  • Ignoring Higher-Timeframe Structure and getting stopped out by moves driven by levels you weren’t aware of
  • Drawing Support and Resistance Subjectively instead of using an objective, pattern-based method tied to real swing points
  • Holding Through a Level Break because you didn’t realize the liquidity line had already been swept
  • Cluttering Your Chart with stale levels that price already invalidated, creating confusion instead of clarity
  • Missing Stop-Hunt Setups where price briefly pierces a swing high or low to grab liquidity before reversing
  • Entering Counter-Trend Trades at Random Levels instead of waiting for price to reach a defined higher-timeframe swing extreme
  • Placing Stops at Obvious Levels right where the 3-bar pattern tells you liquidity is sitting, making you the hunter instead of the hunted
  • Overcomplicating Your Analysis with lagging indicators when a simple structural read of swing highs and lows gives you the edge
0